Instances — Overview
Every service you monitor in CodeXray has a dedicated detail page with tabs — Overview, Traces, Logs, Runtime, Profiling, Deployments (plus DB Insights when the service makes database calls). The Overview tab is the landing page: one scroll that shows everything that matters about the service's health and behaviour.
If someone asks "is the checkout service healthy right now?", the Overview tab answers in one glance — without you touching another view.
Where to Find It
Open any service from the Applications list. The page lands on the Overview tab by default.
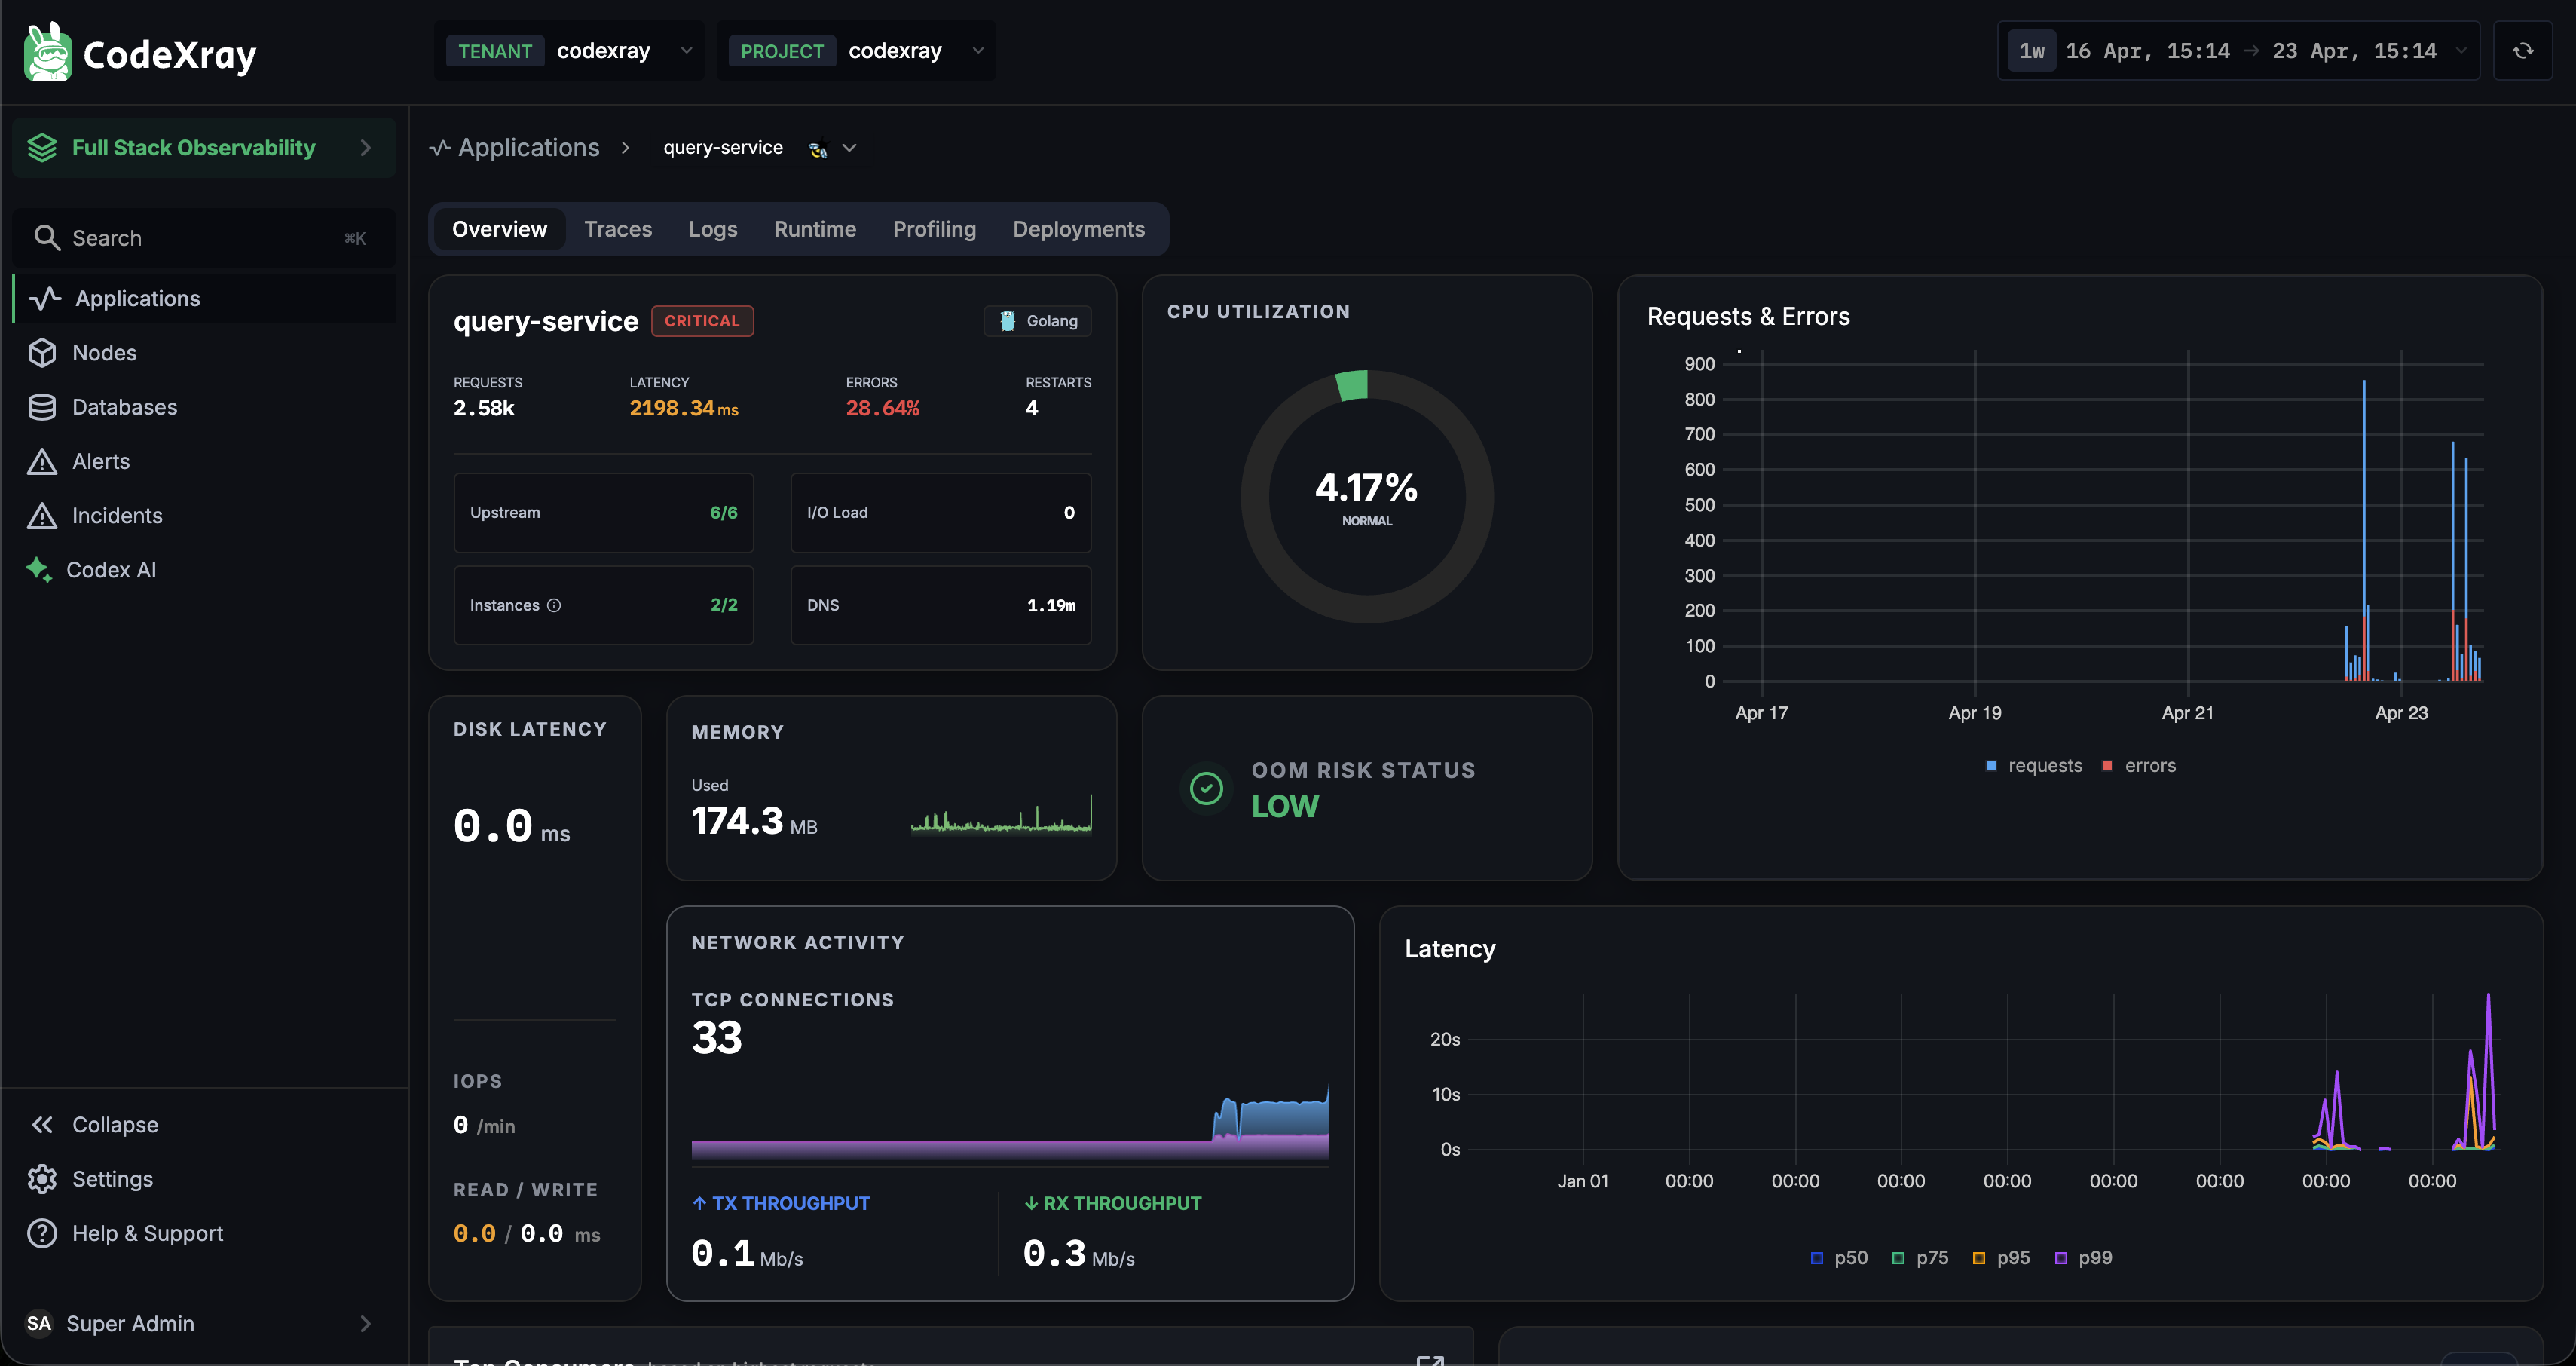
The Header Strip
The top of the page is organised around three themes, side by side.
1. Health strip (left)
A compact KPI block with the single most important service facts:
| Item | What it tells you |
|---|---|
| Service name + status badge | OK / WARNING / CRITICAL — derived from SLOs, errors, and resource pressure |
| Language badge | Detected runtime (Golang, Java, Python, .NET, Node.js, …) |
| REQUESTS | Total requests in the selected window |
| LATENCY | Mean latency |
| ERRORS | Error percentage |
| RESTARTS | How many times the containers of this service restarted |
| Upstream | healthy / total upstream dependencies |
| Instances | healthy / desired replicas |
| I/O Load | Instantaneous I/O pressure |
| DNS | DNS latency — a common hidden source of request slowness |
If any of these cross a threshold, they show in red on the card — so the page lights up problems without scrolling.
2. CPU Utilization (middle)
A donut showing average CPU usage across the service's instances, with a category label underneath (NORMAL / WARNING / CRITICAL). For a quick check: "are we hot?"
3. Requests & Errors chart (right)
A stacked time-series of request volume (blue) with errors (red) overlaid. Lets you correlate error spikes and traffic shifts visually in the selected window.
Resource Summary Cards
A second row of cards covers the service's local resources — everything you'd check when a service is slow but the upstream looks fine.
| Card | Contents |
|---|---|
| DISK LATENCY | Current disk read/write latency |
| MEMORY | Used memory + sparkline over the selected window |
| OOM RISK STATUS | LOW / MEDIUM / HIGH — prediction based on memory trend and limit |
| IOPS | Operations per minute, plus READ / WRITE latency in ms |
| NETWORK ACTIVITY | TCP connection count, TX/RX throughput |
| Latency | p50 / p75 / p95 / p99 time-series |
These cards collapse several Runtime-tab charts into a single glance. If anything looks anomalous, click through to the appropriate tab for the full detail.
Top Consumers, Service Map, and Traces
Scroll down and the Overview gives you an incident-investigation starter pack.
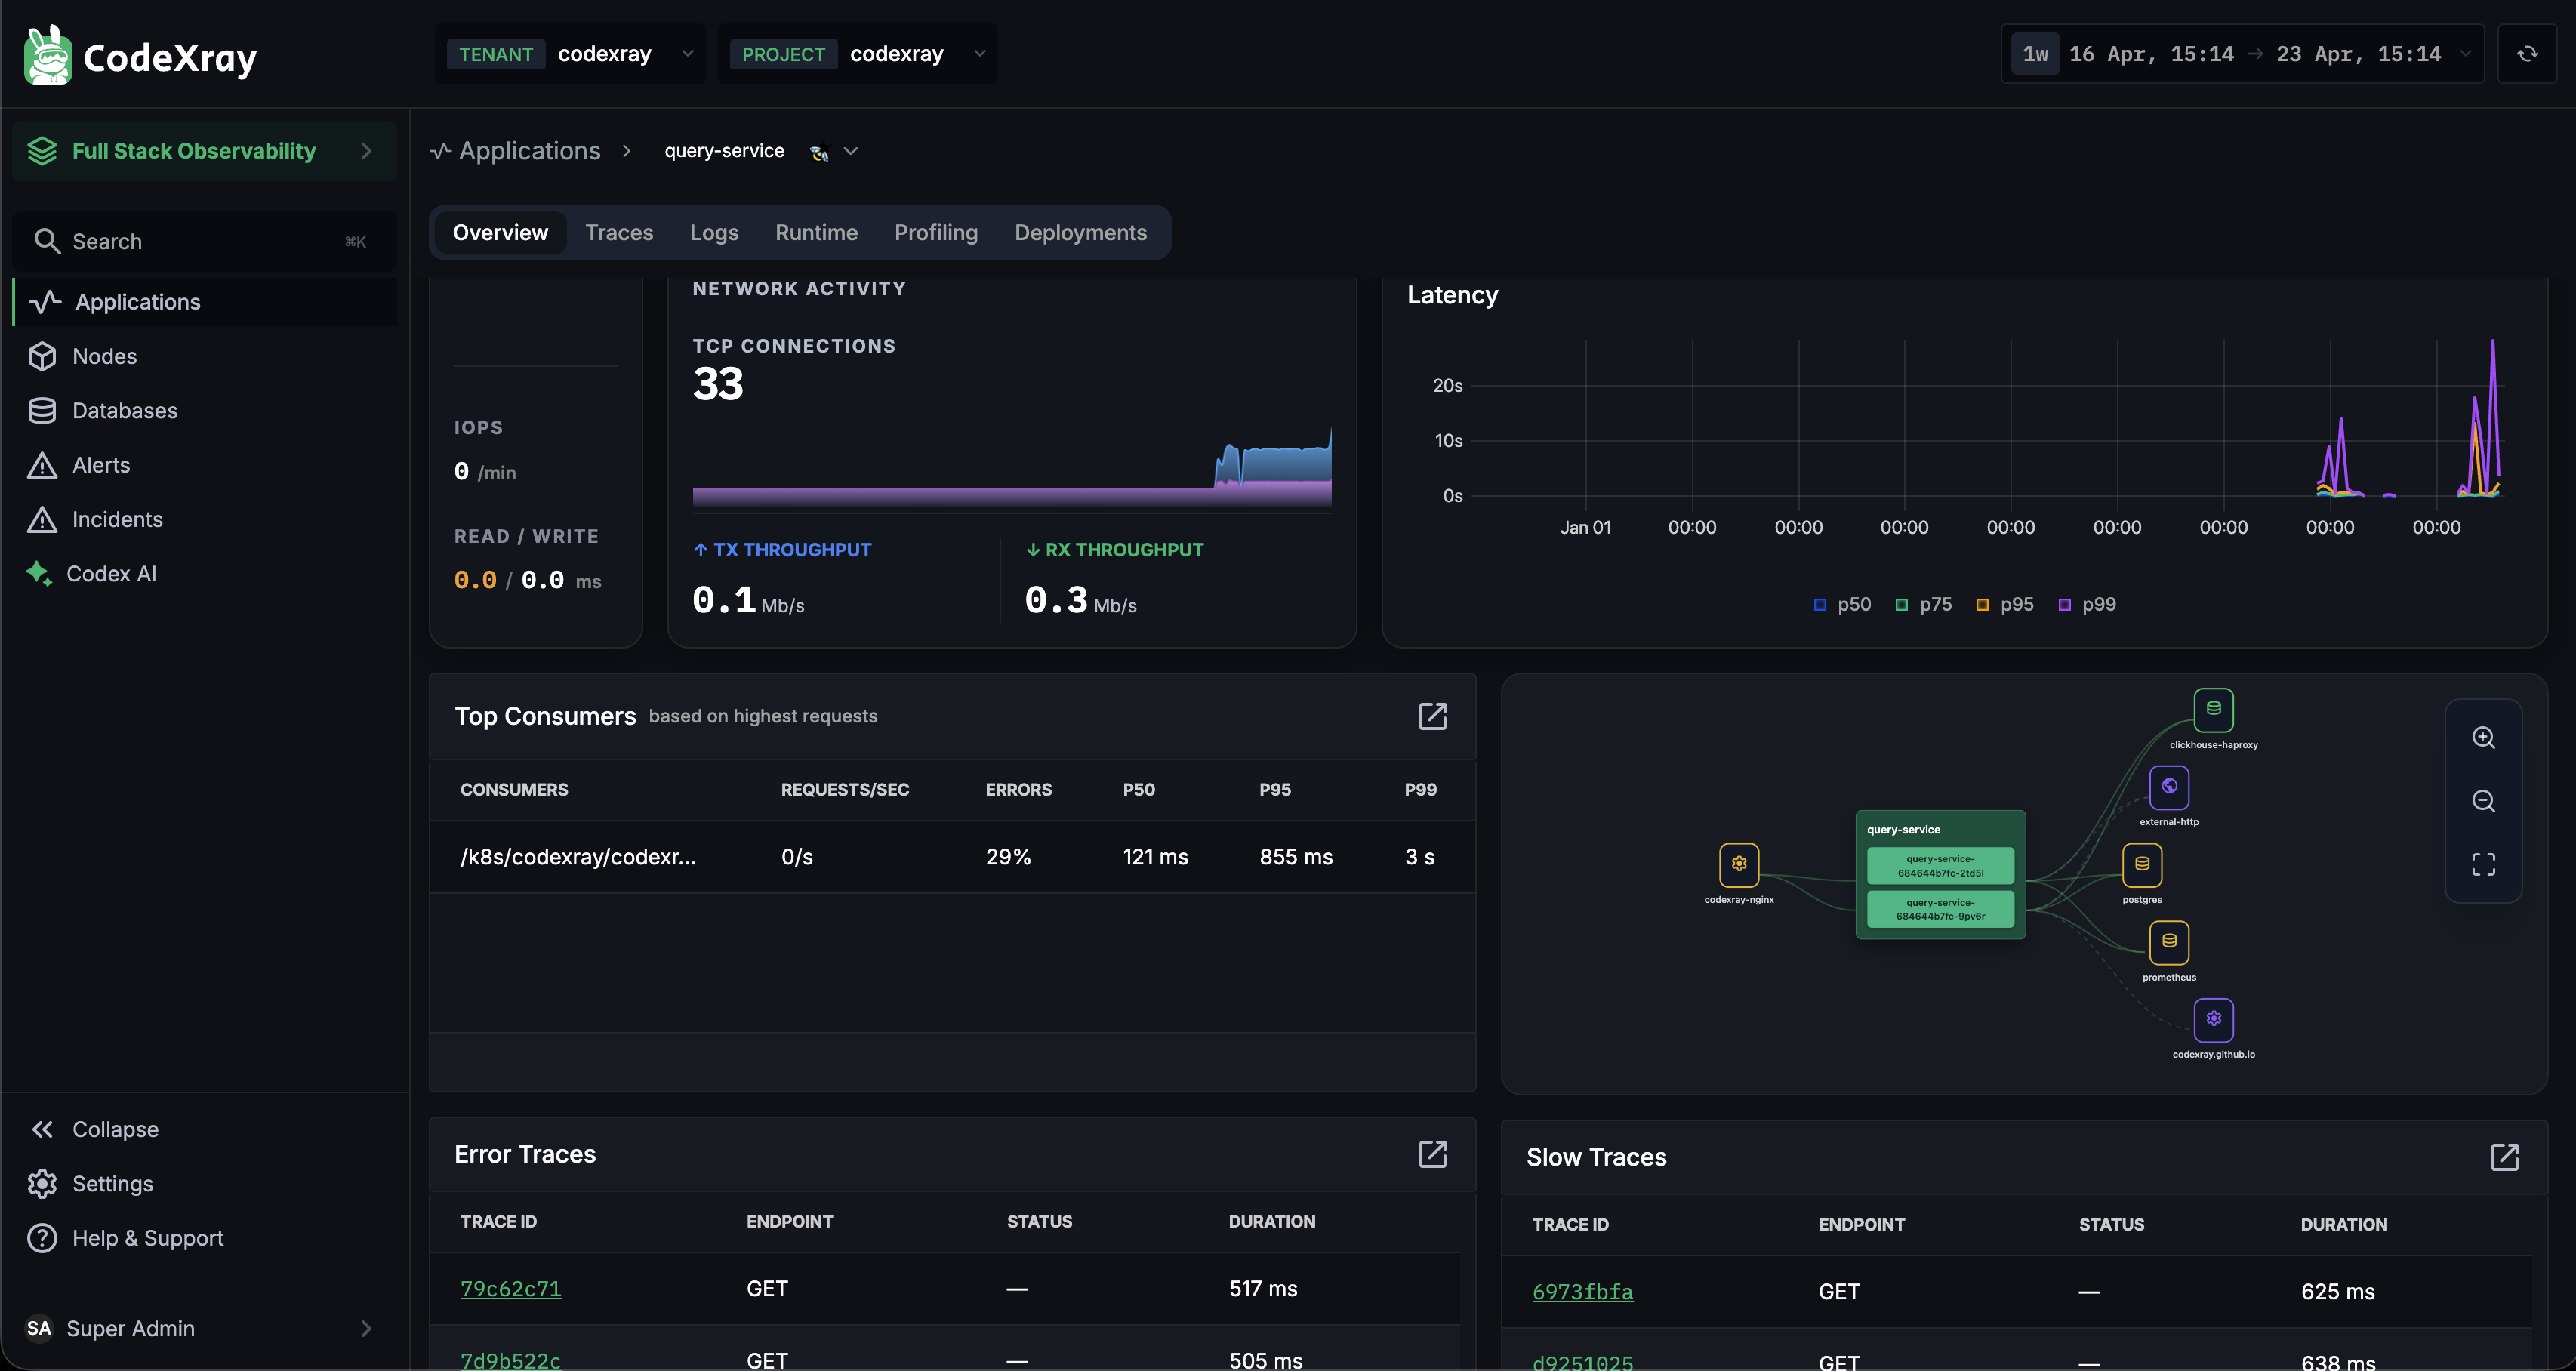
Top Consumers
The callers driving the most requests to this service, with per-caller error rate and p50/p95/p99 latency. Instantly identifies "who is hammering this service?". Useful for noisy-neighbour investigations and capacity planning.
Service Map (mini)
A compact service-graph fragment centred on the selected service — its upstream callers, its downstream dependencies, and the live traffic between them. The full-screen version lives in the Topology view in the main sidebar.
Error Traces + Slow Traces
Two side-by-side tables showing recent traces where things went wrong — errors on the left, latency outliers on the right. Each row is clickable and opens the trace detail (see Distributed Traces Overview).
What Each Tab Covers
The Overview is the landing page, but the detail lives on sibling tabs:
| Tab | Covered in |
|---|---|
| Overview | This page |
| Traces | Distributed Traces Overview |
| DB Insights | Database Insights |
| Logs | Application Logs and Querying |
| Runtime → CPU | CPU |
| Runtime → Memory | Memory |
| Runtime → Network | Network |
| Runtime → DNS | DNS |
| Profiling | Profiling Overview |
| Deployments | Deployments |
Next Steps
- CPU — per-instance CPU, throttling, node-level context
- Memory — per-instance memory, node-level context, top consumers
- Network — outbound connection map, TCP RTT, throughput, retransmissions
- DNS — per-domain lookup rate, NXDOMAIN / SERVFAIL errors, resolver latency
- Deployments — release history with auto-detected regressions