Database Insights
Database Insights is a built-in tab inside every application view in CodeXray. It answers a question developers and SREs ask constantly during incidents and reviews:
"How is my service using its databases — and which queries are hurting us?"
Instead of jumping to a separate tool or writing ClickHouse queries, open an application, switch to the DB Insights tab, and you get a service-scoped view of every database call it makes.
Where to Find It
Open any service from the Applications list, then switch to the DB Insights tab.
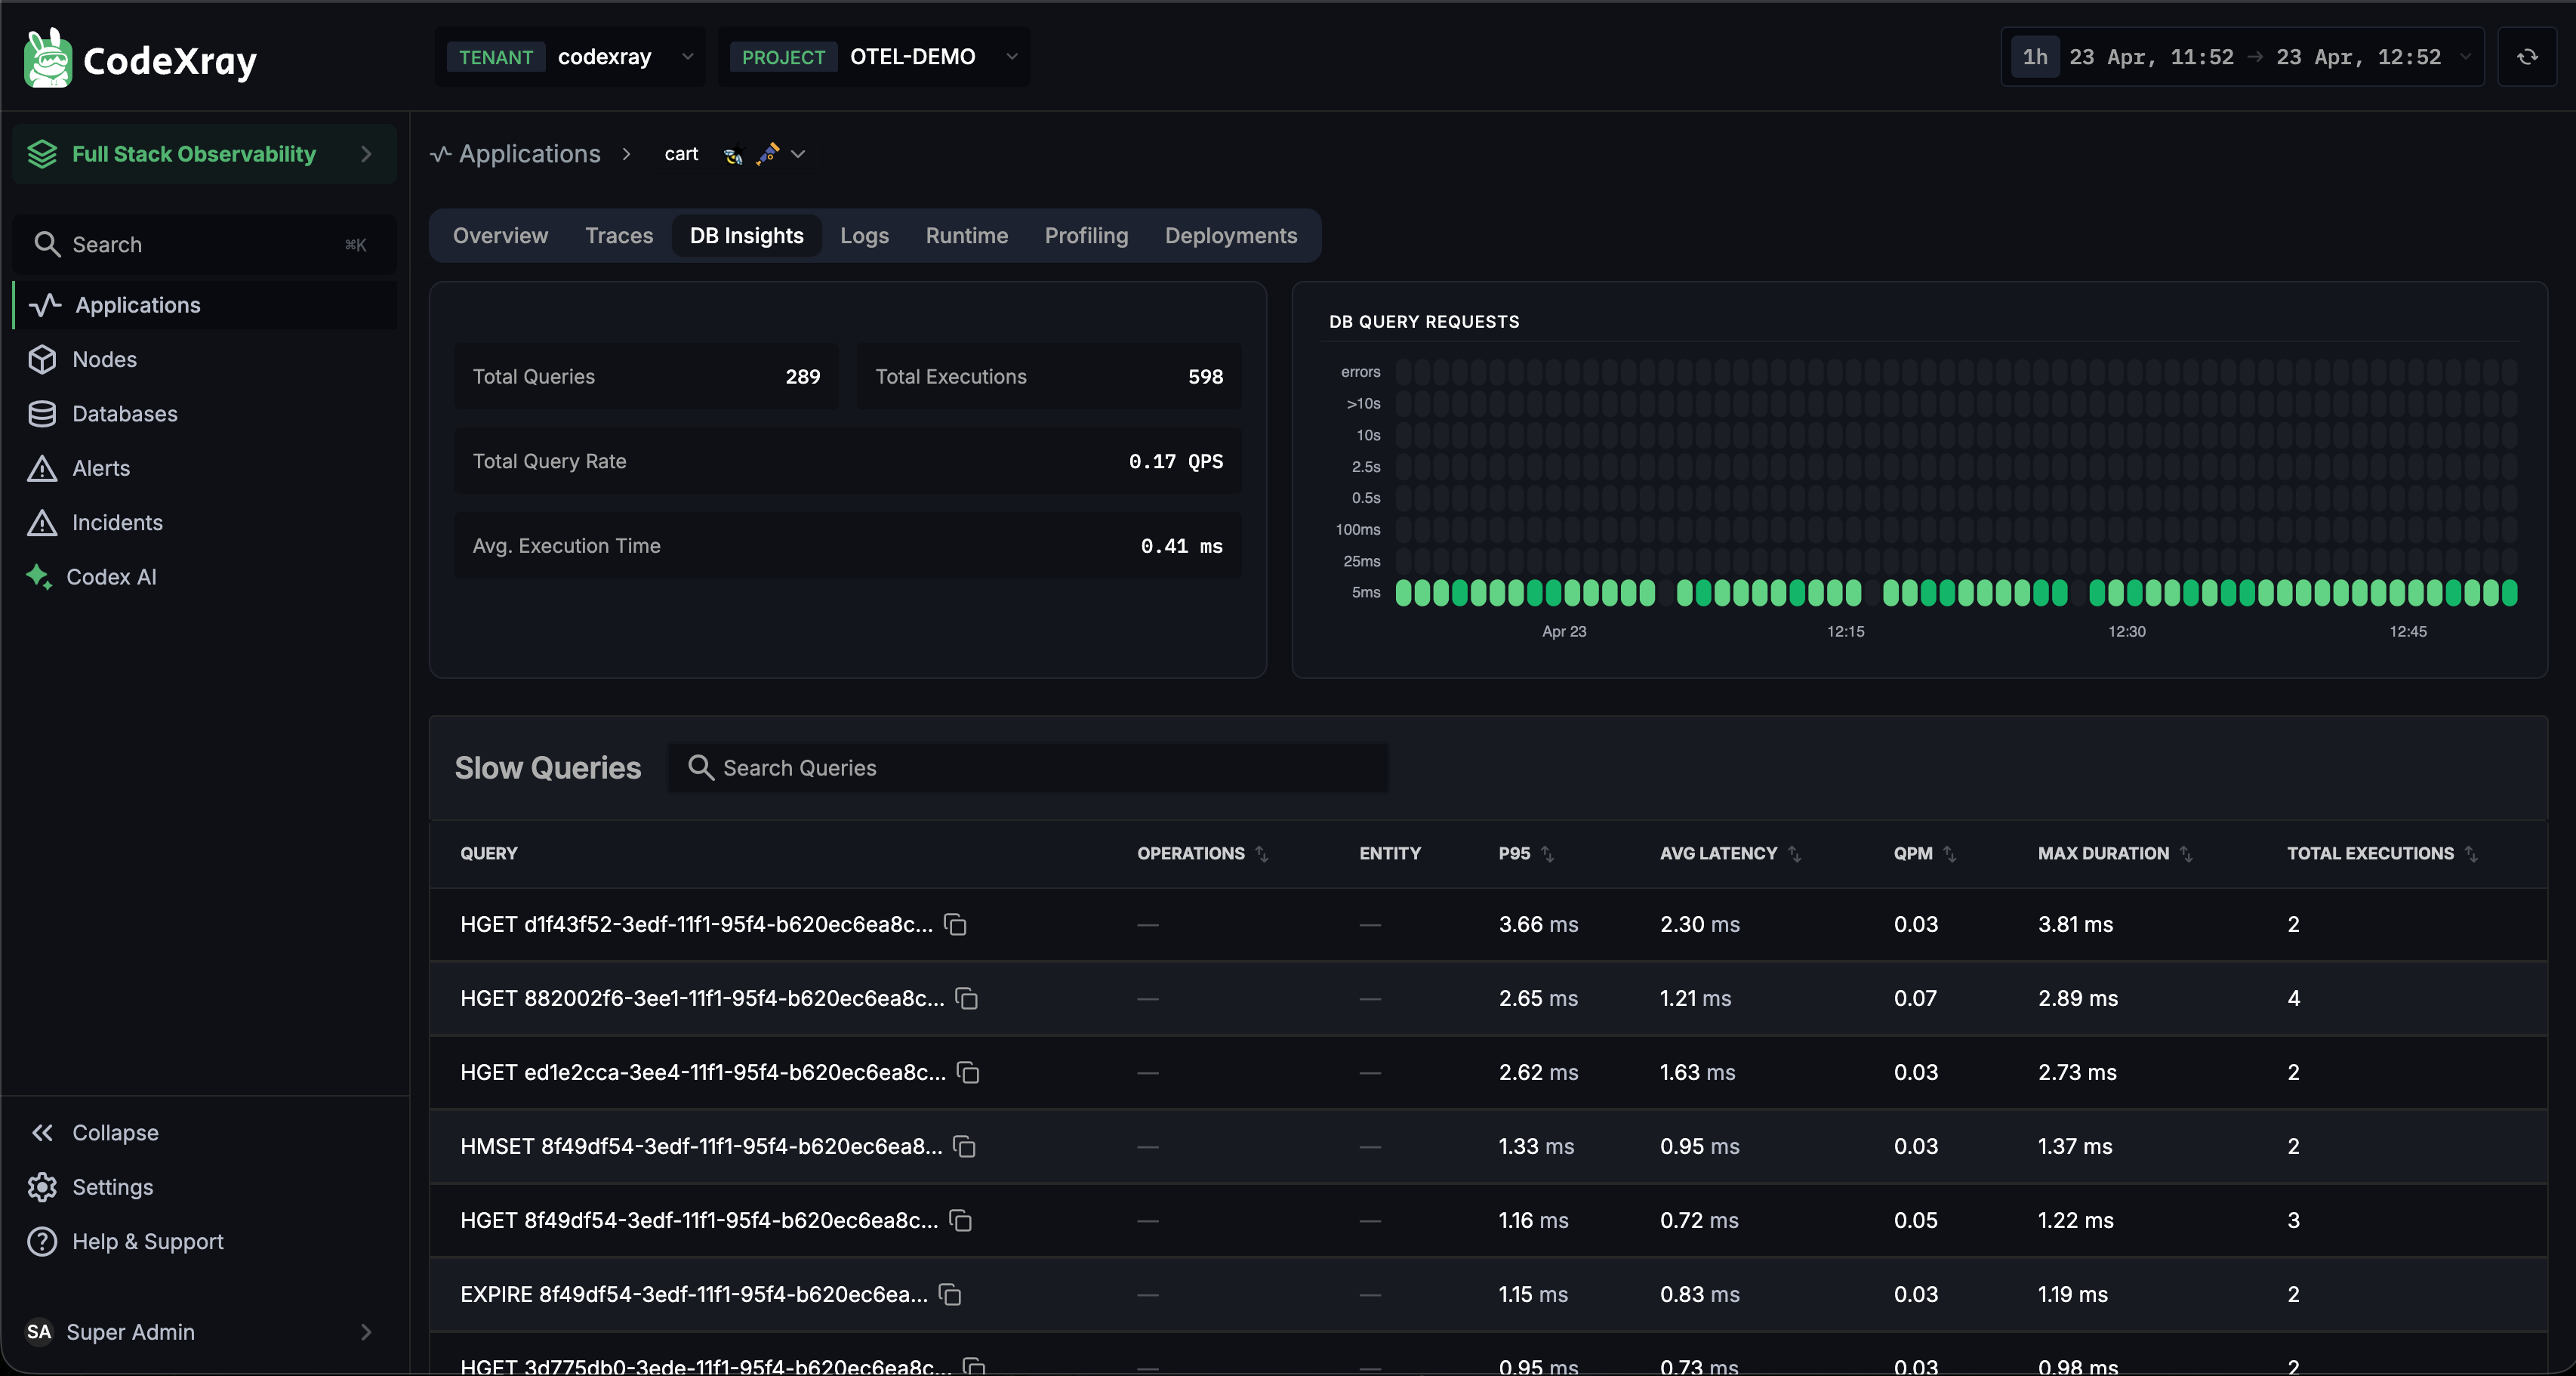
The tab sits alongside Overview, Traces, Logs, Runtime, Profiling, and Deployments — so all database context lives next to the rest of the service's observability signals.
Every metric, chart, and query on this page is filtered to the selected service. Switch services in the Applications list and the view updates to show that service's database behaviour — with no manual filtering.
What the Page Shows
Database Insights is organised into three sections, top to bottom, each answering a different question.
1. Headline Metrics
Four numbers summarise the service's current database footprint:
| Metric | What it tells you |
|---|---|
| Total Queries | Number of distinct query patterns seen in the selected time range |
| Total Executions | Total number of query calls made (across all patterns) |
| Total Query Rate | Queries per second the service is issuing |
| Avg. Execution Time | Mean latency across all database calls |
Together these give you an at-a-glance sense of query diversity, load, and latency. A sudden jump in Total Executions with a steady Total Queries count, for example, means your service is calling the same queries more often — not that new queries appeared.
2. DB Query Requests Chart
A time-series view of query volume over the selected window. Use it to:
- Spot load spikes that correlate with incidents or deployments
- Compare pre- and post-release query volume to see if a change increased database pressure
- Confirm whether a slowness event was driven by raw volume or by query inefficiency
3. Slow Queries Table
The heart of the tab. A ranked list of the queries this service is making, with the signals you need to triage them fast:
| Column | Meaning |
|---|---|
| Query | The query fingerprint — parameterised values collapsed so the same pattern groups together |
| Operations | Operation type (GET / SET / SELECT / INSERT / etc.) |
| Entity | The table, key pattern, or collection the query targets |
| P99 | 99th-percentile latency for this query |
| Avg Latency | Mean latency for this query |
| QPM | Queries per minute |
| Max Duration | Slowest single execution seen in the window |
| Total Executions | How many times this query ran in the window |
The table is searchable — useful when you know the shape of the query you're hunting for but not where it sits in the ranking.
4. From Query to Trace
Click any row in the Slow Queries table and it expands inline to reveal the full distributed trace that contained that query — not just the database call, but the entire request that triggered it.
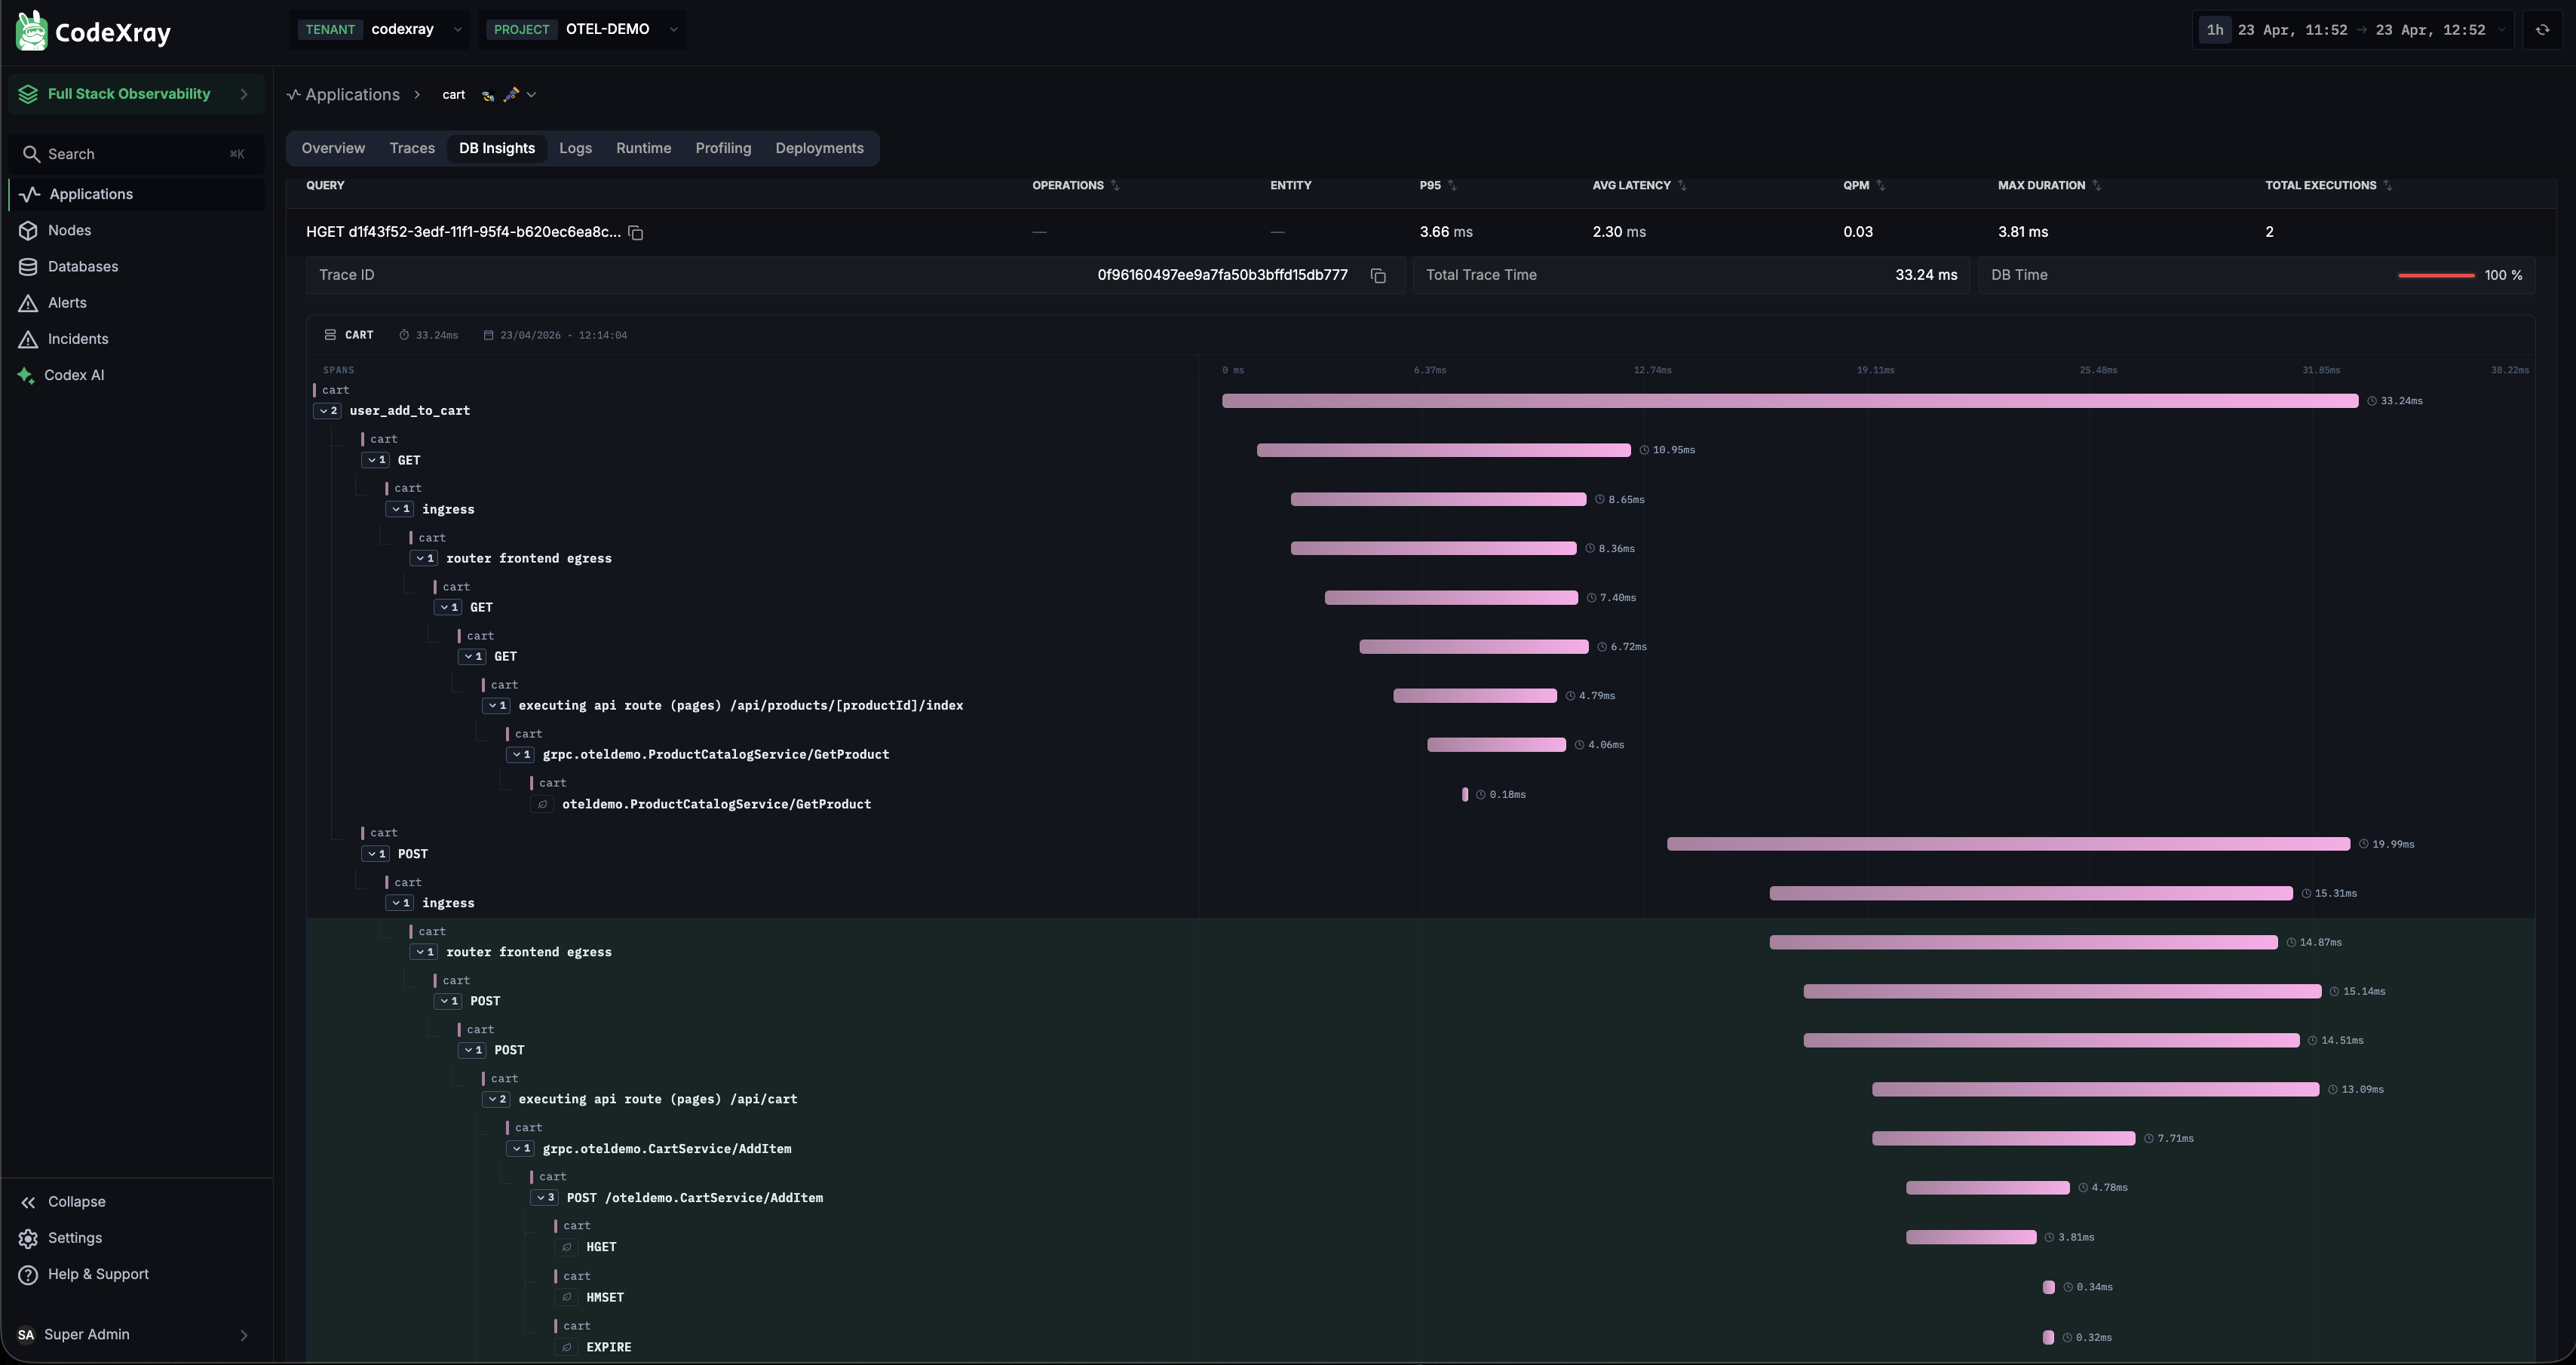
The expanded view shows:
- Trace ID for the specific execution — copy it to jump to the full trace viewer
- Total Trace Time and DB Time — instantly see how much of the request was spent in the database versus everywhere else
- Full span tree — every operation in the request, indented by call depth, with latency bars aligned to a common timeline so slow hops are visually obvious
- Cross-service context — downstream calls (HTTP, gRPC) made by the same request are all visible, so you can tell whether the database was the true bottleneck or just a symptom of upstream behaviour
This drill-down is what turns Database Insights into an investigation surface rather than just a dashboard. You go from a query fingerprint → a real execution → the full request context in two clicks.
How to Use It
Database Insights is designed to collapse three common investigation paths into one page:
"My API is slow — is the database responsible?"
Open the affected service, go to DB Insights, and scan the Slow Queries table ordered by latency. Spot a query with a P99 matching your API's regression — expand the row to see the full trace of one such execution. The trace immediately tells you whether the query dominates request time, or whether it's one slow hop among several. No separate trace search required.
"We deployed an hour ago — did we make the database worse?"
Check the DB Query Requests chart across a window spanning the deployment. A sharp increase in volume or a new entry at the top of the Slow Queries table points at the change. Correlate with the service's Deployments tab for the exact release boundary.
"Which queries should we optimise first?"
Sort the Slow Queries table by Total Executions × Avg Latency (total time spent). The top rows are where an index, cache, or query rewrite would move the needle most — not the single slowest query, but the one that burns the most cumulative time.
Supported Databases
Any outbound database call captured via OpenTelemetry instrumentation in your service will appear here — so support tracks OTel's coverage:
- Key-value / cache: Redis, Memcached
- Relational: PostgreSQL, MySQL, MSSQL, Oracle
- Document: MongoDB, Couchbase
- Wide-column: Cassandra
The example screenshot above is from the cart service talking to Redis (visible from the HGET, HMSET, and EXPIRE operations in the Slow Queries table).
Database Insights is the consumer view — how this service uses its databases. If you want the engine view — active connections, replication lag, locks, cache hit ratios — use the Databases module in the main sidebar.
Prerequisites
Database Insights works out of the box for any service instrumented with OpenTelemetry. No additional configuration on CodeXray's side is required. On the application side:
- Instrument your service with the OpenTelemetry SDK for its language.
- Make sure the database client library you use has OTel instrumentation enabled (most modern clients do, either natively or via a contrib package).
- Deploy the service — Database Insights starts populating within a few minutes.
Java, .NET, Python, Node.js, and Go all have strong OpenTelemetry database instrumentation. See the CodeXray .NET Agent page for .NET-specific setup.
Next Steps
- Application Categories — group services so the most important ones surface first
- Custom Applications — define application boundaries that match your reality, not just your deployment units
- Architecture — how application and database telemetry flows through the platform