Instances — DNS
DNS is the most underrated source of hidden latency in microservices. Every slow lookup, every NXDOMAIN, every SERVFAIL blocks the request it was made for — and when DNS misbehaves, the symptoms usually show up in your app's latency numbers with no obvious cause.
The Runtime → DNS tab gives you per-service DNS visibility: which domains this service is resolving, how often, which lookups are failing, and how long resolution is taking.
When p99 latency climbs but CPU, memory, and the database all look fine, the DNS tab is the next place to look. A 5-second cluster-DNS timeout inside a request handler can destroy your latency numbers while moving nothing else on your dashboards.
Where to Find It
Applications → service → Runtime tab → DNS (left sidebar inside the tab).
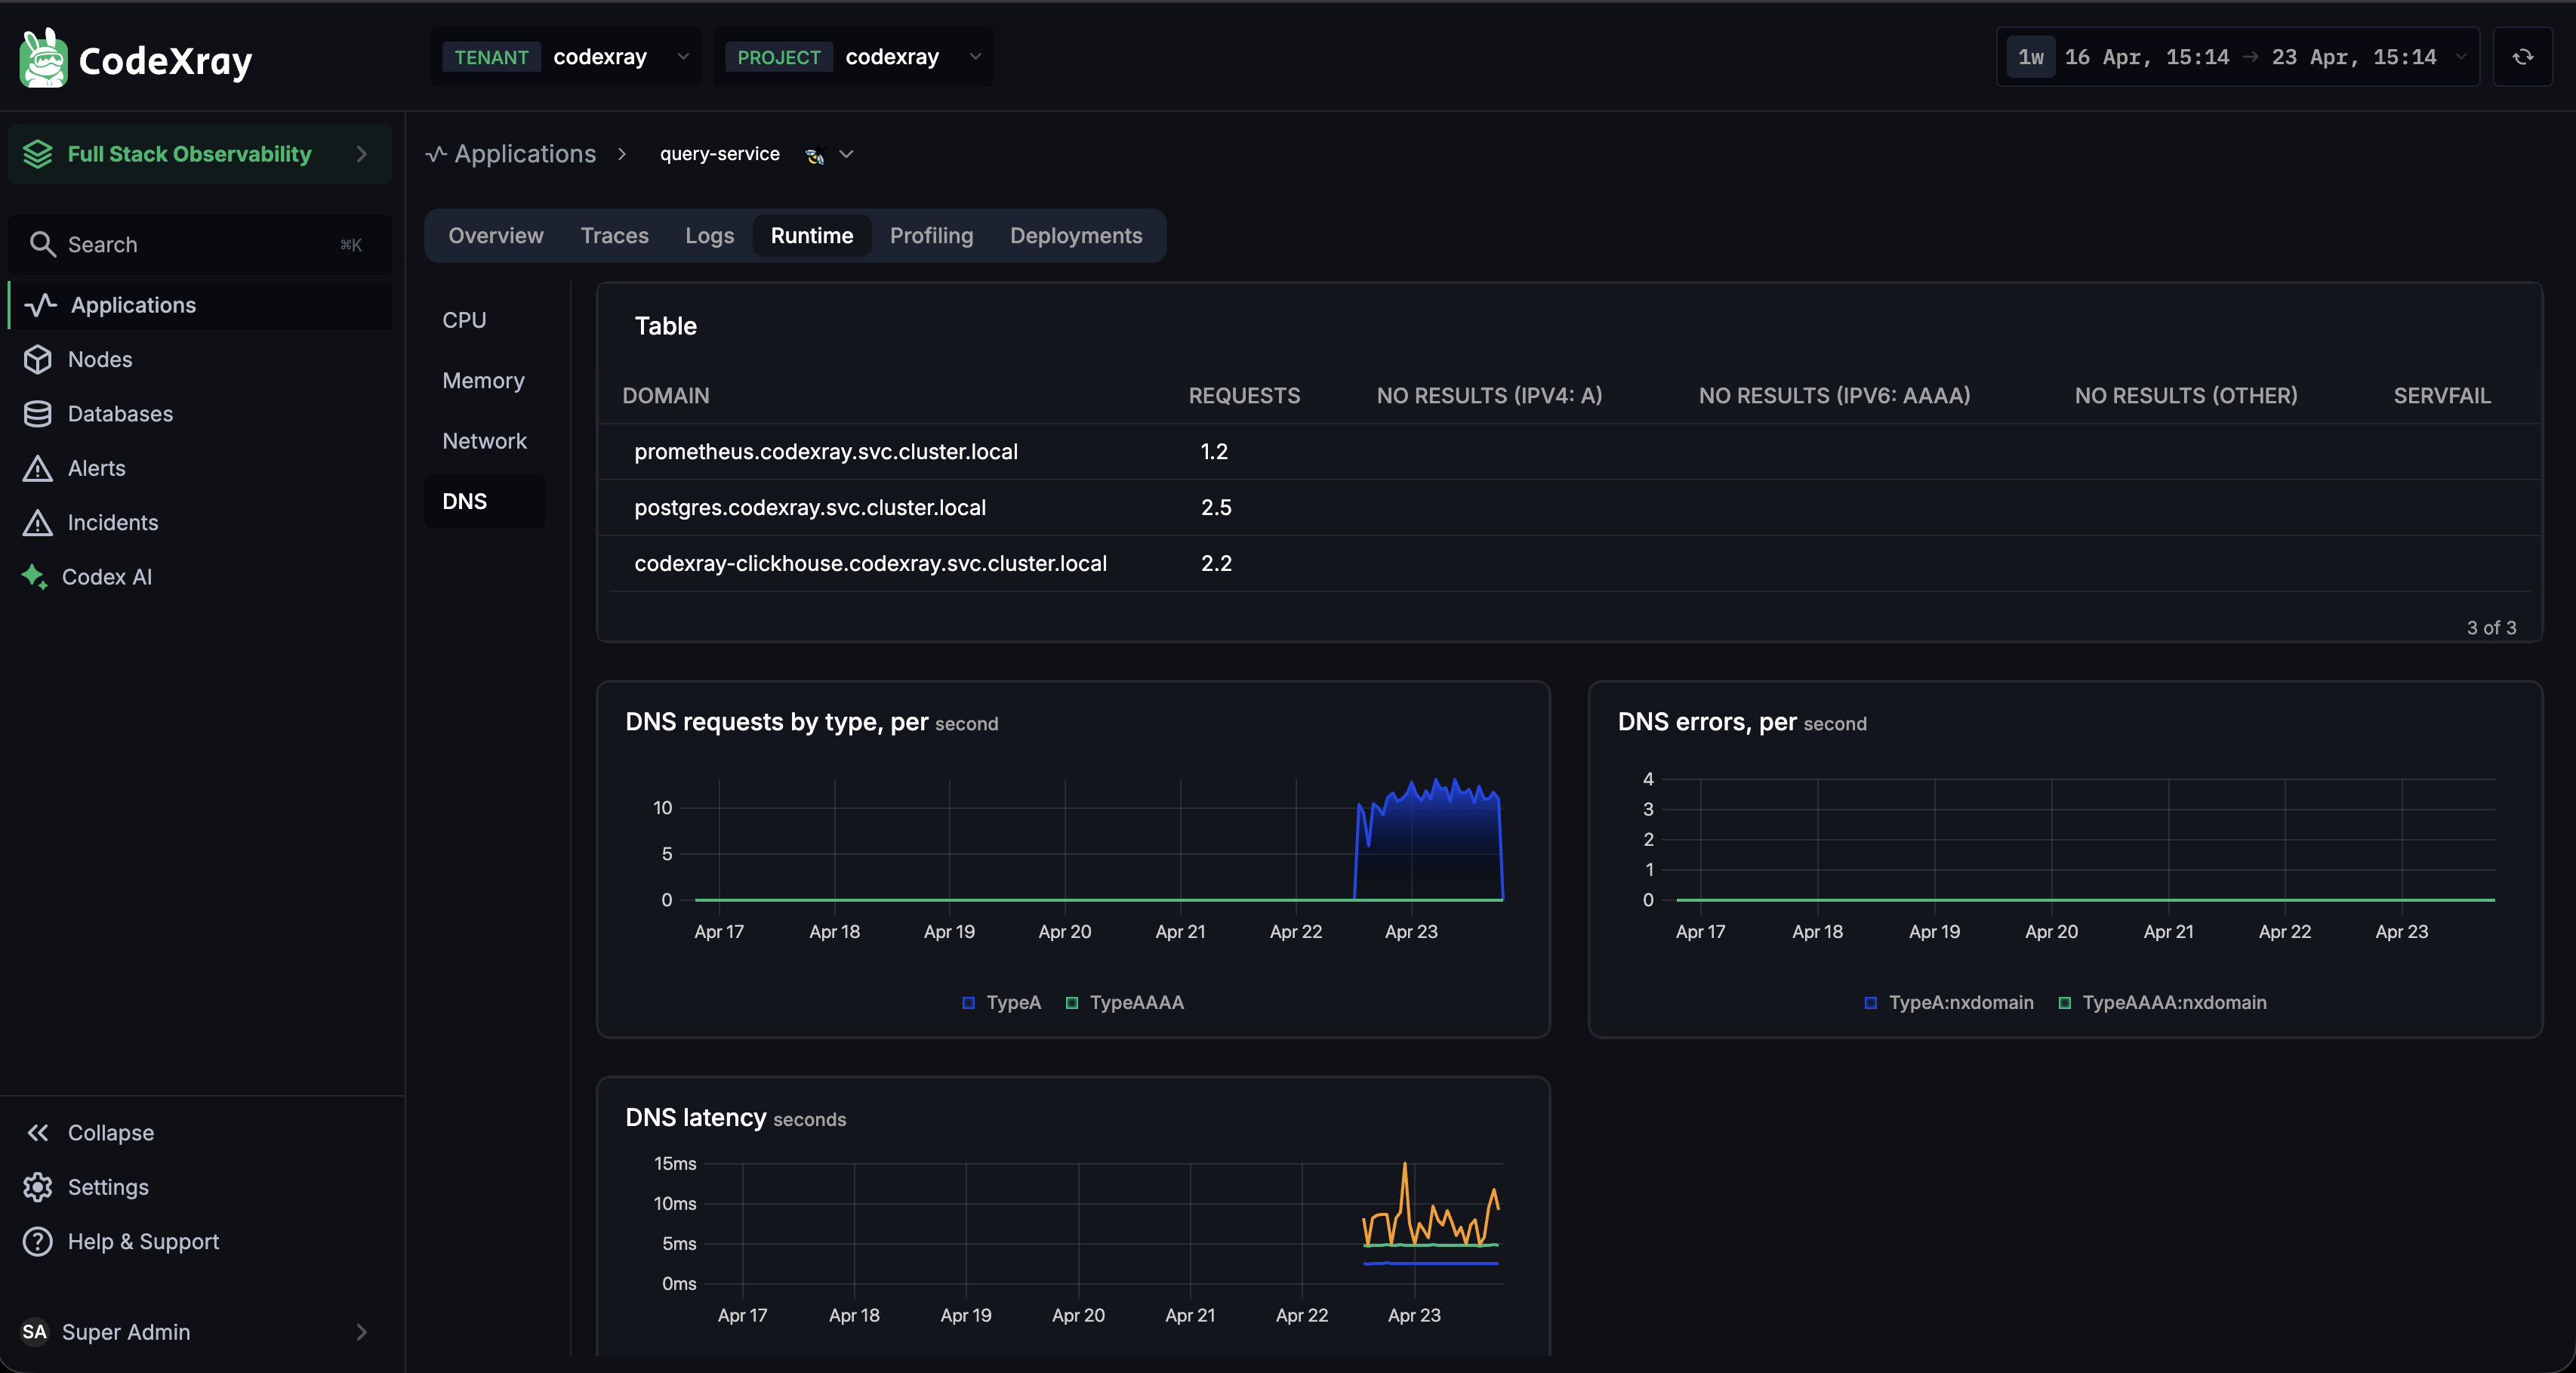
The Domain Table
At the top, a table lists every domain this service resolved in the selected window, with the failure modes broken out per domain.
| Column | Meaning |
|---|---|
| DOMAIN | The full DNS name being resolved (e.g., postgres.codexray.svc.cluster.local) |
| REQUESTS | Lookups per second averaged across the window |
| NO RESULTS (IPV4: A) | NXDOMAIN responses for IPv4 A-record lookups |
| NO RESULTS (IPV6: AAAA) | NXDOMAIN responses for IPv6 AAAA-record lookups |
| NO RESULTS (OTHER) | NXDOMAIN for other record types (SRV, CNAME, TXT, etc.) |
| SERVFAIL | SERVFAIL responses — the resolver couldn't answer at all |
NXDOMAIN and SERVFAIL columns should generally be zero. Non-zero values call out specific misconfigurations or resolver failures — click the domain to see the trend over time, then pair with the charts below.
You'll often see an AAAA-only NXDOMAIN column on otherwise healthy domains — this happens when an app asks for both A and AAAA records but the service only has IPv4. Most resolvers handle this gracefully (the app falls back to IPv4), but on stricter setups or slow resolvers the extra round-trip adds latency per lookup. If the column's non-zero and you don't need IPv6, consider disabling AAAA lookups in your glibc /etc/resolv.conf (single-request-reopen and family) or at the app level.
The Charts
Three time-series charts round out the DNS picture.
1. DNS requests by type (per second)
Lookup rate split by record type (TypeA / TypeAAAA / others). Most healthy services have a tight, predictable DNS rate — a sudden spike almost always means someone disabled connection reuse or switched to a shorter TTL.
2. DNS errors (per second)
NXDOMAIN and SERVFAIL rates over time, broken down by record type. A step-change upward that coincides with a deploy or config change is usually an app mistake (wrong hostname); a continuous low-level rate is usually healthy (e.g., occasional cluster-DNS hiccups or speculative AAAA lookups).
3. DNS latency (seconds)
Resolver latency over time. For in-cluster DNS (*.svc.cluster.local), this should be single-digit milliseconds. Anything consistently higher points at an overloaded cluster DNS (CoreDNS / kube-dns), a distant resolver, or TCP-only resolution due to UDP packet loss.
What to expect:
- Cluster DNS, healthy: 1–5 ms
- Cluster DNS, degraded: 30+ ms or frequent spikes
- Cluster DNS, pathological: seconds (due to timeouts / retransmission)
- External DNS (public resolvers): 10–50 ms typical
Common Workflows
"p99 latency just jumped — is DNS involved?"
- Open DNS latency for the affected service. If there's a correlated spike, DNS is in the critical path.
- Check DNS errors for NXDOMAIN or SERVFAIL spikes — a misconfiguration will show here first.
- If latency is bad but errors are zero, the resolver is overloaded (not misconfigured). Look at your cluster DNS Pods — CPU, restart counts, and scale.
"Is my app making unnecessary DNS lookups?"
Look at the REQUESTS column — sort by rate. A connection-pooled service should resolve each dependency once and reuse the pool. High per-domain request rates (multiple per second for a single peer) indicate:
- DNS caching is disabled (some HTTP clients)
- TTLs are too low on the resolver
- Connection pooling is broken and every request re-resolves
"I'm seeing SERVFAIL errors — what's broken?"
SERVFAIL means the resolver tried and failed to answer — usually upstream is sick (e.g., your authoritative DNS is timing out, or CoreDNS can't reach the upstream it proxies to). Check your cluster-DNS Pods' logs — the resolver logs SERVFAIL causes explicitly.
"AAAA NXDOMAINs are ruining my dashboards"
If every lookup generates an AAAA NXDOMAIN alongside a successful A response, you're paying for IPv6 you don't use. Options:
- Disable AAAA at the libc level (
options single-request/single-request-reopenin/etc/resolv.conf) - Disable IPv6 lookups in your app's resolver (e.g., Go
GODEBUG=netdns=go+v4) - Ignore them — they're usually cosmetic if A lookups still succeed promptly
What Feeds This View
- DNS request capture — eBPF uprobes on libc's resolver functions and kernel-level DNS traffic — captures every lookup with domain, record type, response code, and latency
- Domain aggregation — the Node Agent groups lookups by FQDN and builds the domain table
- Resolver identity — which nameserver answered is tracked per request
All collected automatically by the Node Agent. No application-side setup required.
Next Steps
- Deployments — the next Instances tab: release markers, release-over-release diffs, and auto-generated summaries
- Network — once DNS resolves, the connection lives here
- CPU and Memory — the rest of the Runtime sub-views
- Node Agent Metrics — the
container_dns_*metrics that power these charts