Application Logs and Querying
Every application in CodeXray has its own Logs tab — a dedicated, service-scoped log view with severity filters, two viewing modes, search, and deep correlation to the service's traces and infrastructure.
You'll spend most of your investigation time here. The page answers three questions in the order you usually ask them:
- What's the overall log volume look like right now? (the time-series chart)
- What's dominating that volume? (Patterns View)
- Give me an example I can dig into (List View + Detail Panel)
Where to Find It
Open any service from the Applications list, then switch to the Logs tab. The tab sits alongside Overview, Traces, Runtime, Profiling, and Deployments — so log context lives right next to every other signal for the service.
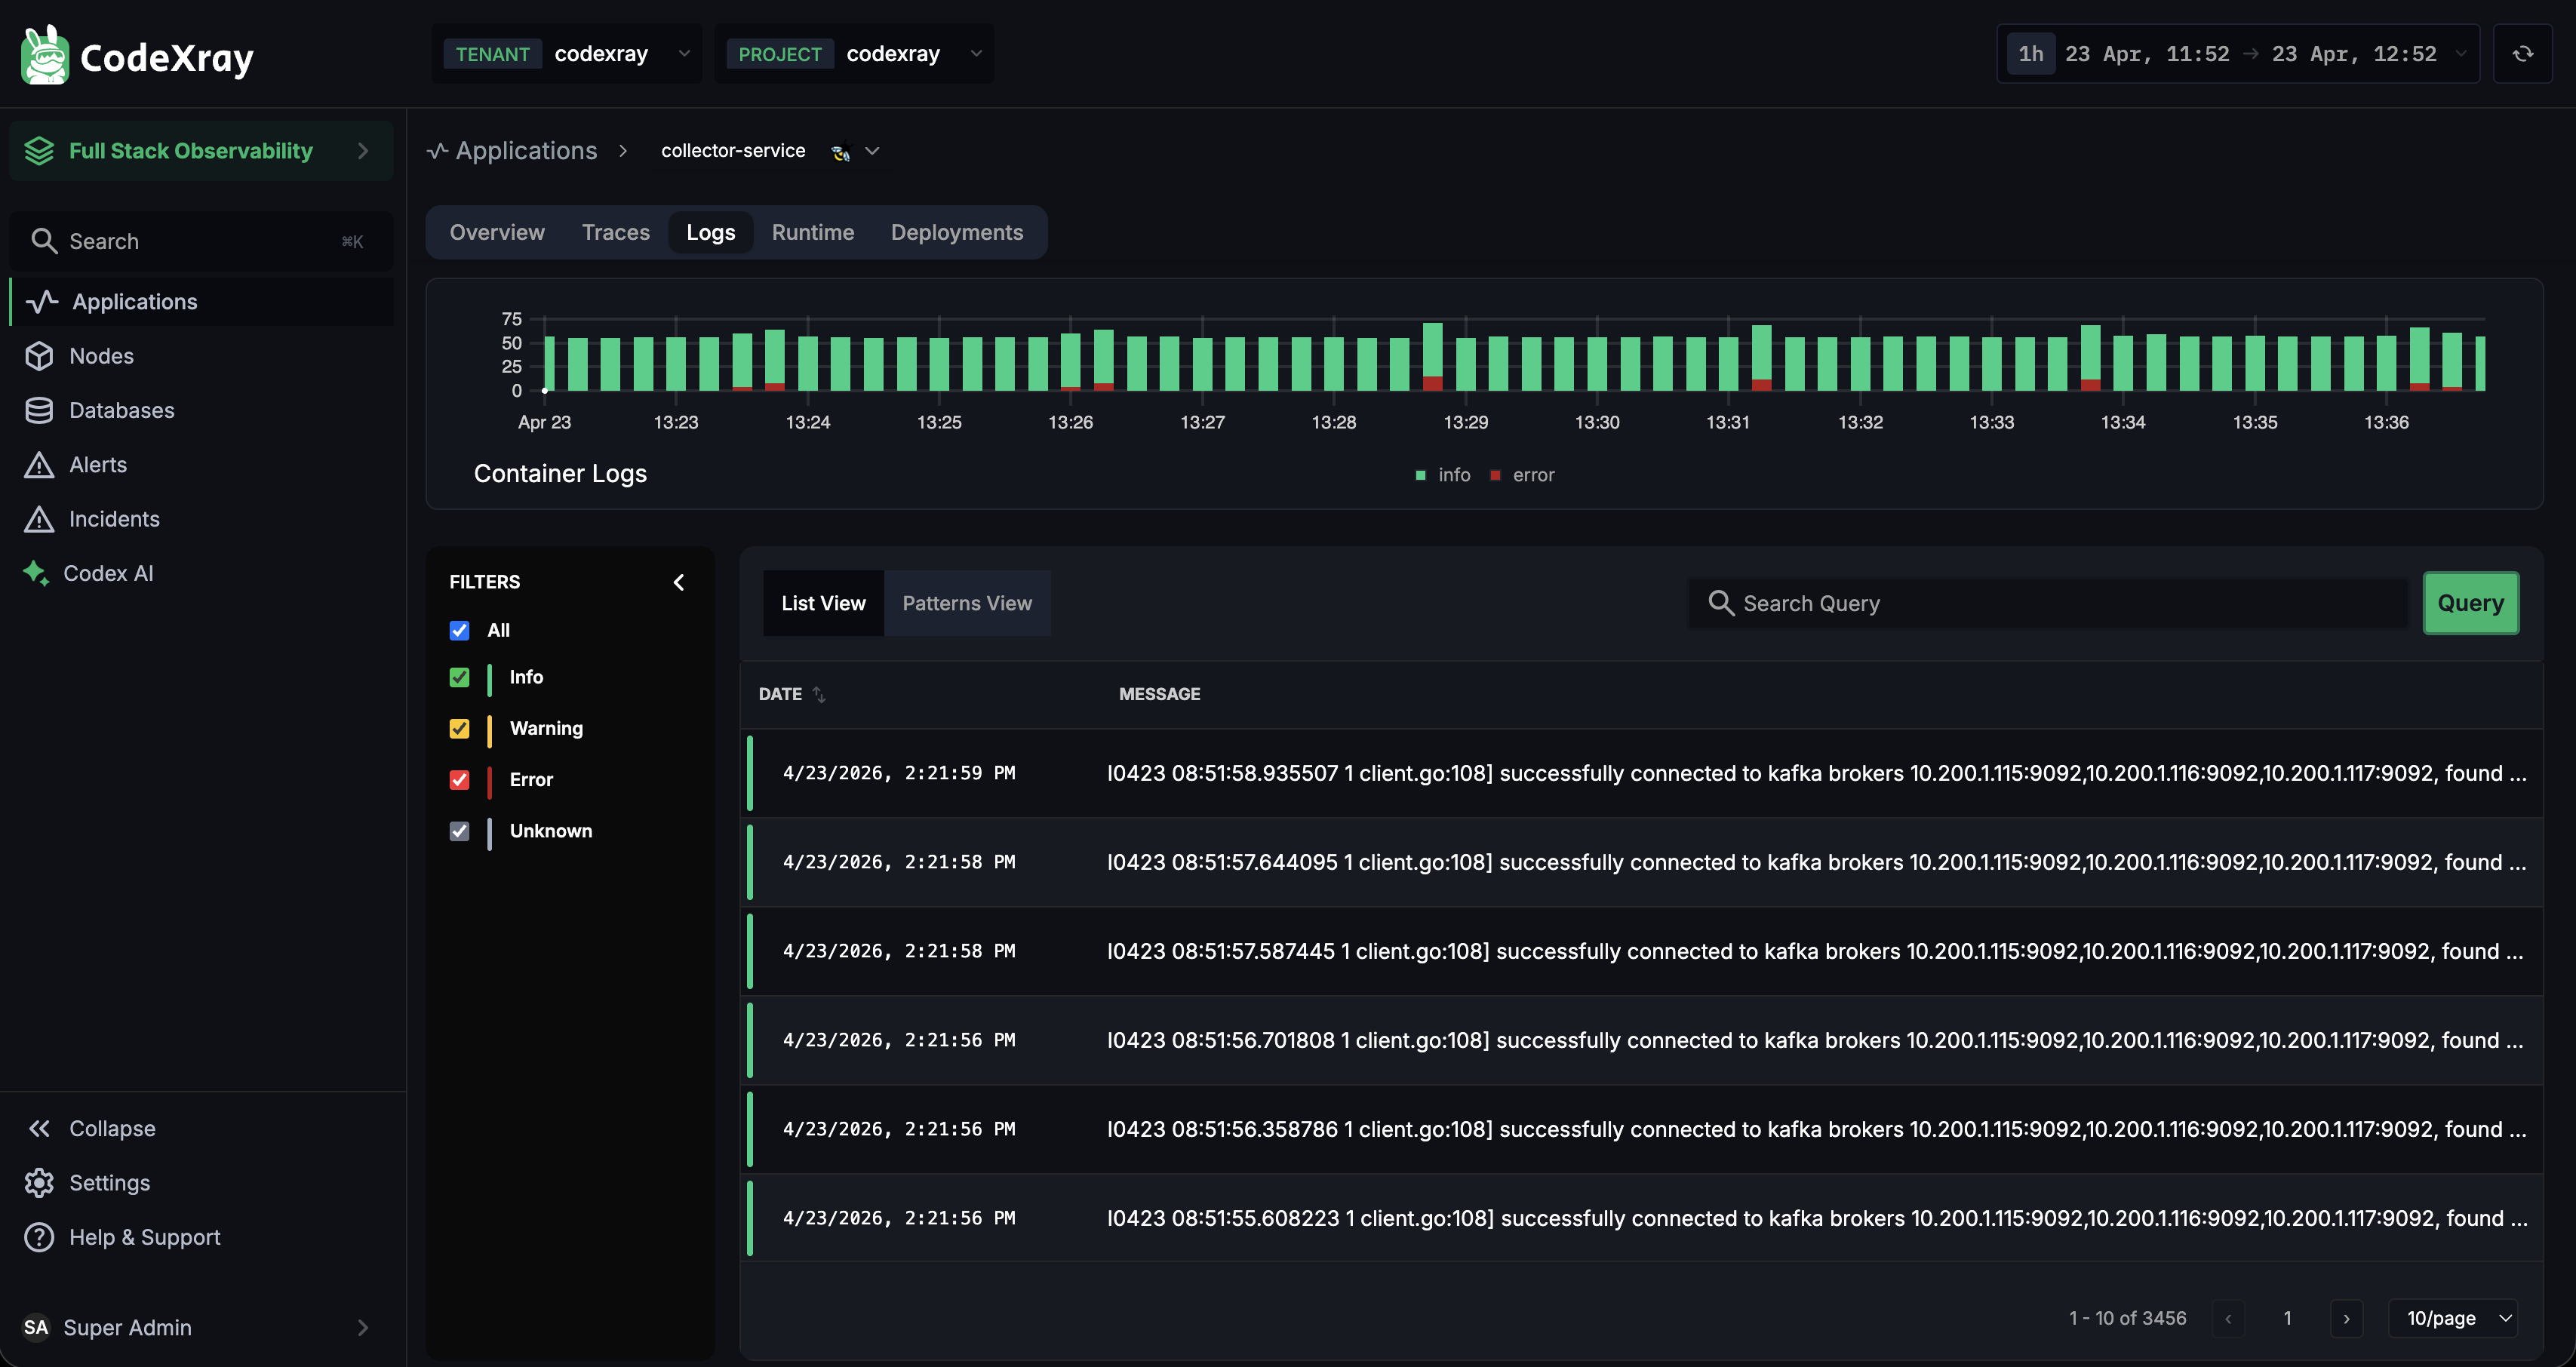
Everything on the page is scoped to the selected service. Change services in the sidebar and the view updates automatically.
Anatomy of the Page
Three primary regions, top to bottom:
1. Log Volume Chart
A stacked bar chart of log volume over time, broken down by severity. The legend at the bottom shows which colours map to which severity (info, error, etc.). Use it to:
- Spot spikes that align with incidents or deployments
- Confirm a service is actually logging (a flat, empty chart means it isn't)
- Compare volumes before and after a release
2. Filter Panel (left side)
The filter panel has two groups:
Severity — All · Info · Warning · Error · Unknown checkboxes with colour indicators. Tick off the ones you want to remove from the view; the chart and the table update live. Scoping to Error-only is the single most common move during an incident:
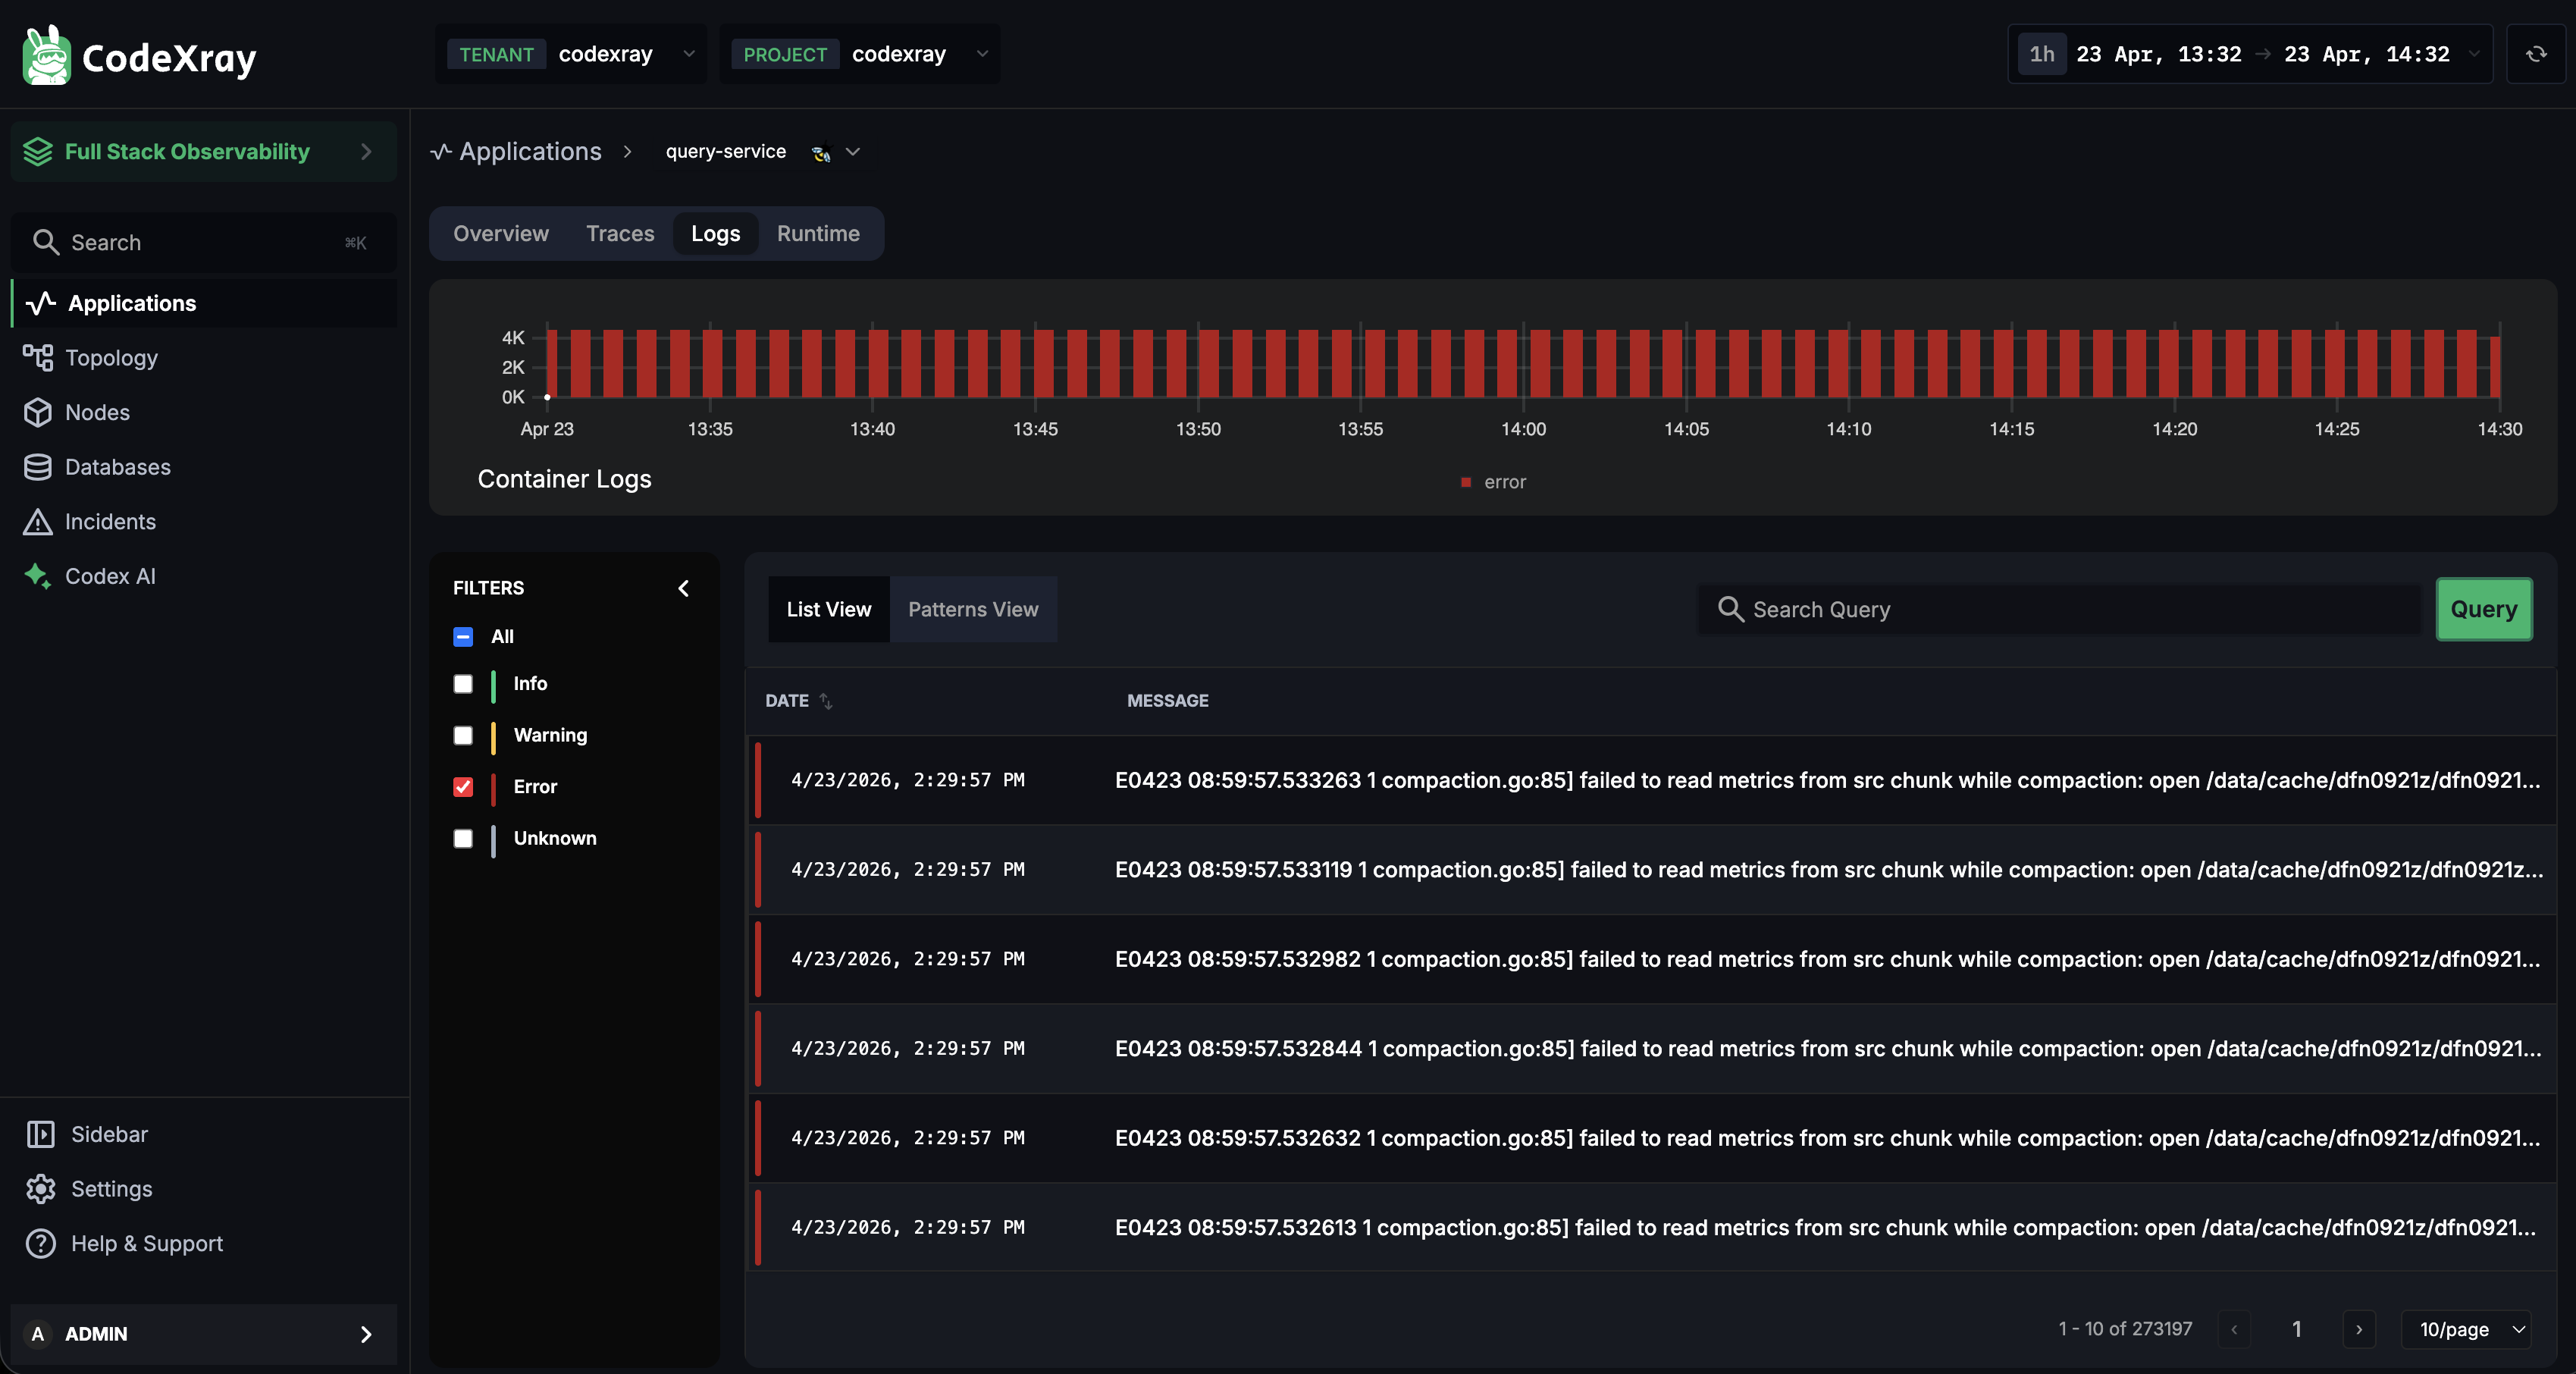
The time-series chart now shows only error volume (all red bars) and the table shows 273,187 error entries for the selected window.
Source — a radio selector that appears when a service has both log sources enabled (see Log Sources below). Switches the view between container-level and application-level logs.
3. Content Area (main)
This is where you toggle between List View and Patterns View, and where the search bar lives.
List View — Raw Log Entries
The default mode. Each row is a single log entry with its timestamp and message. Rows are paginated with a page-size selector at the bottom right.
Click any row to open the Log Detail Panel.
Use List View when:
- You already know what you're looking for — one specific error or event
- You're tailing logs during a rollout and want recent entries
- You need to copy a full log line verbatim
Patterns View — Clustered Patterns
Flip the toggle from List View to Patterns View and the page switches from showing every individual line to showing grouped patterns, ranked by volume.
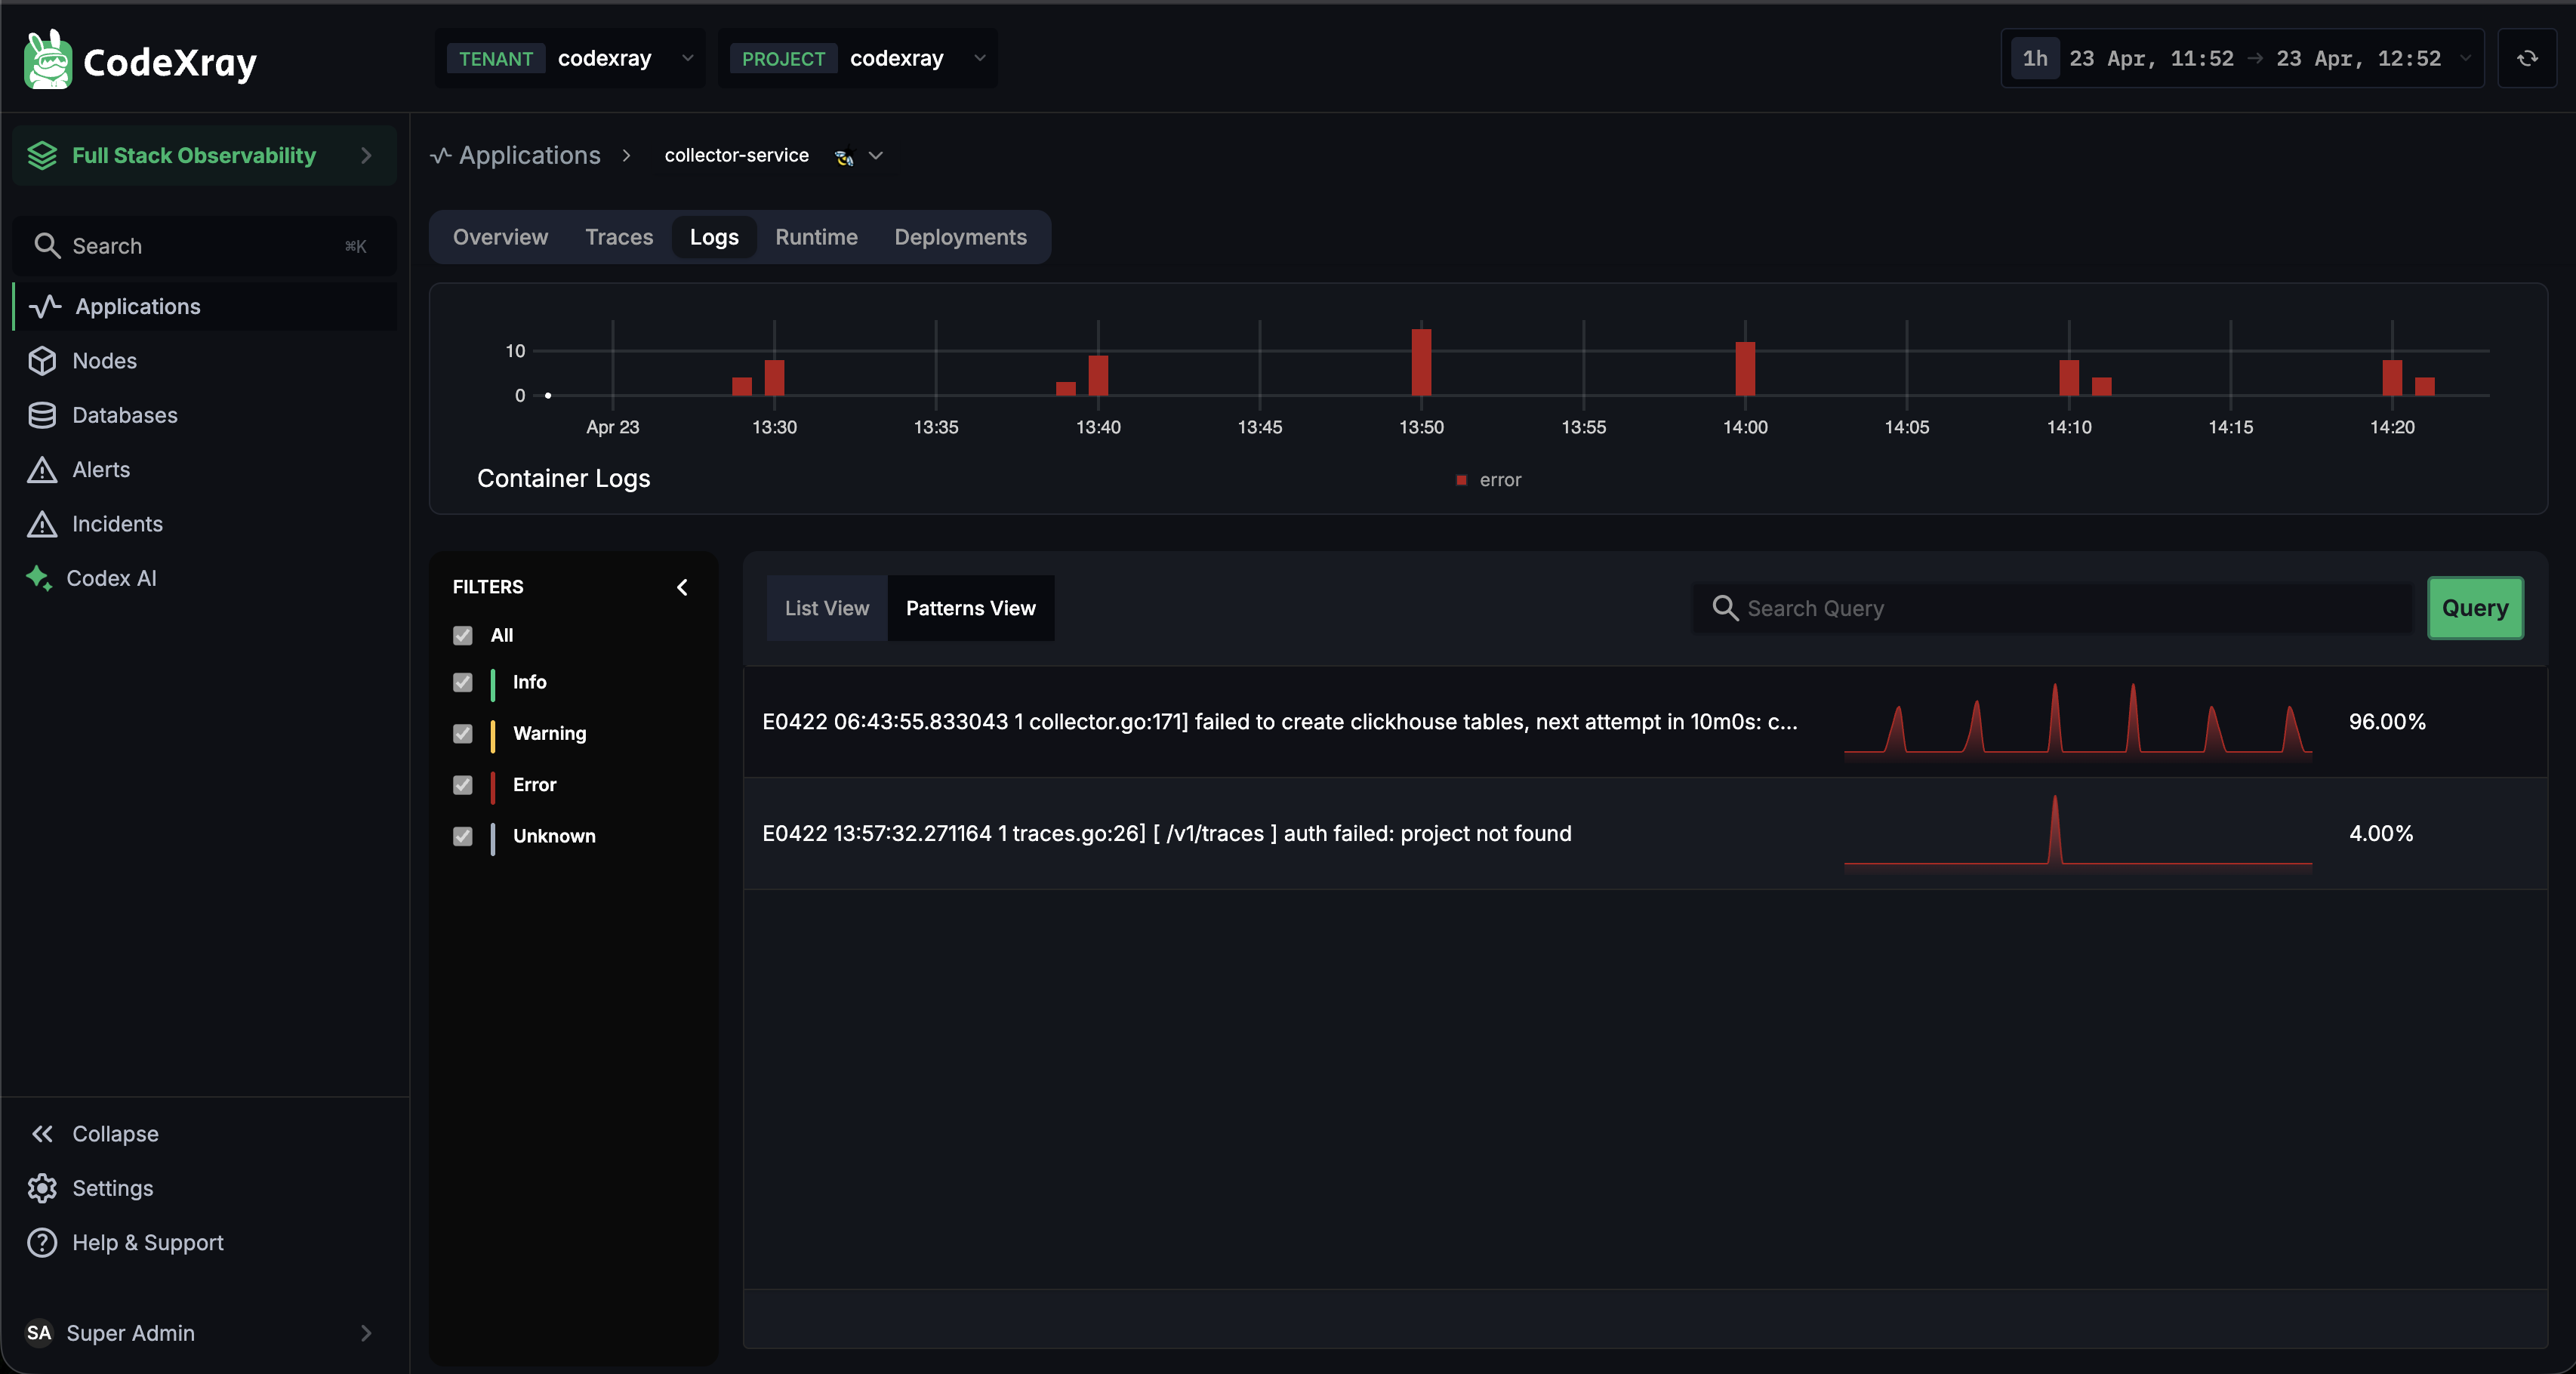
Each row is one pattern. The columns show:
- The pattern text — a representative log line for the cluster
- A sparkline — how often the pattern has fired over the selected time range
- A percentage — this pattern's share of the total log volume in view
In the screenshot above, one pattern (failed to create clickhouse tables...) accounts for 96% of all logs from this service — the obvious place to start any investigation.
For any non-trivial investigation, Patterns View is faster than List View. A service with 3,000 logs might only have 10 distinct patterns — reading those 10 tells you what's happening in seconds.
Use Patterns View when:
- You're triaging an incident and need to find the dominant error
- You're doing a retrospective to identify recurring problems
- You're trying to cut log noise — the top 3 patterns often cover 80%+ of volume
Searching and Querying
The search bar sits above the table and filters both List View and Patterns View.
Type any text and press the Query button (or hit Enter) — the view narrows to log entries whose messages match your query, honouring any severity filters you have active. Common searches:
failed— all entries containing "failed"timeout— everything about timeoutsconnection refused— quoted multi-word phrasesuser_id=42— structured values inside log lines
Clear the search to return to the full view. The time-series chart re-scales to match the filtered results, so you can visually confirm whether your search query captures a spike.
Log Detail Panel
Click any row in List View — or any pattern row in Patterns View — to open the detail panel.
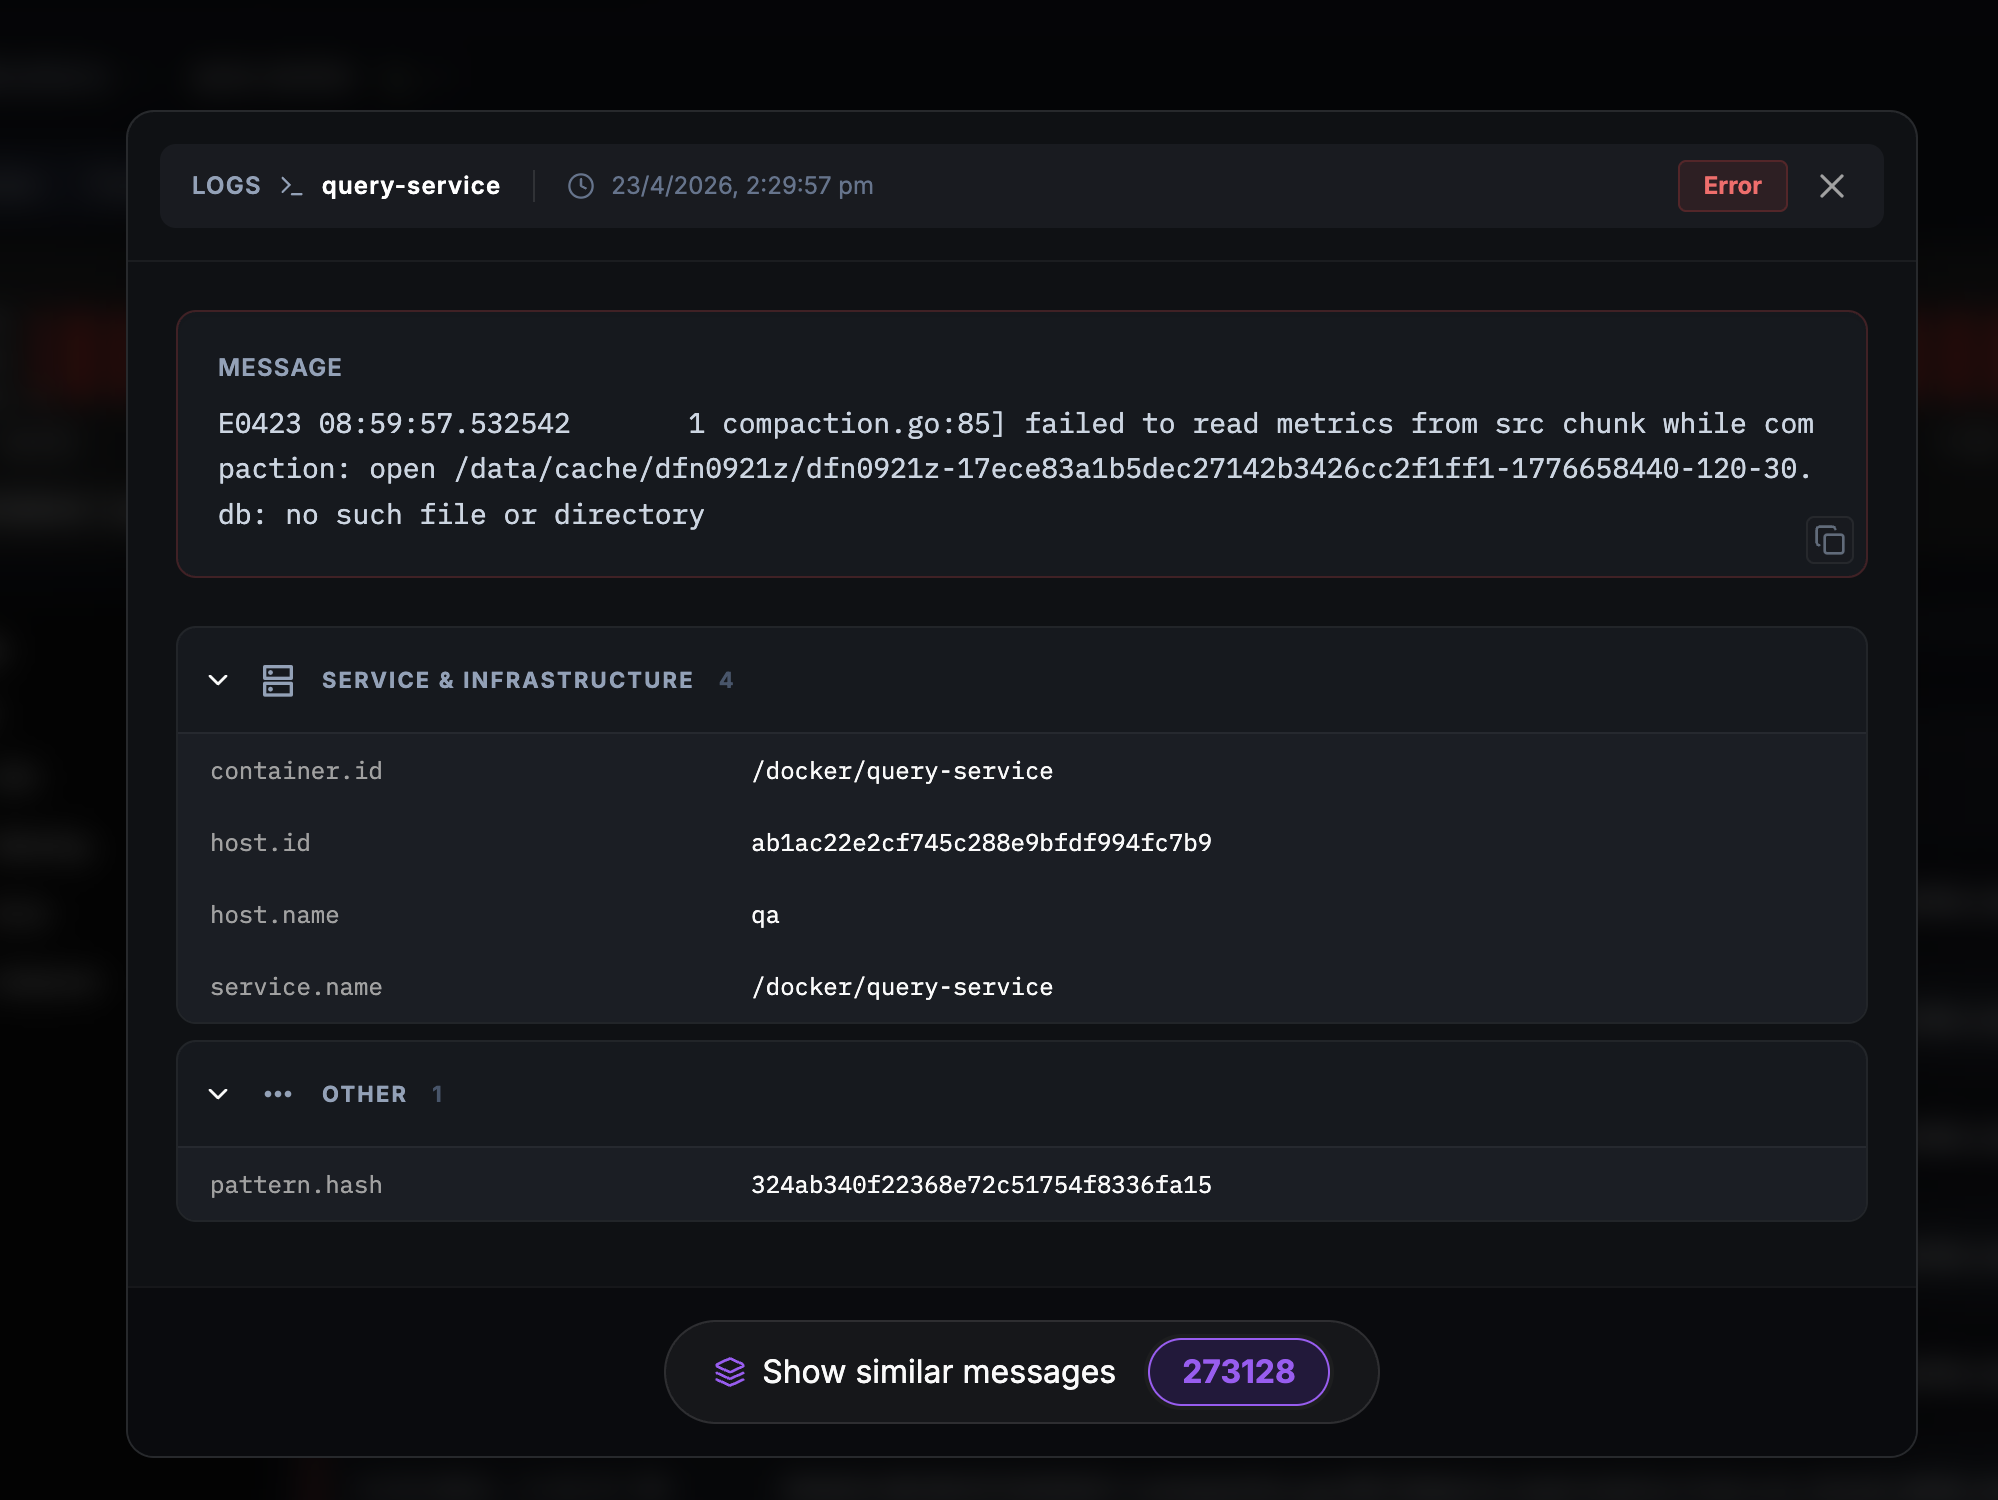
The panel is organised into three sections:
MESSAGE
The full log line, un-truncated, with a copy button. Severity is shown as a badge in the top-right (the red Error badge in the example).
SERVICE & INFRASTRUCTURE
The telemetry attributes that tell you exactly where this log came from:
- container.id — the container path / ID
- host.id — the host identifier
- host.name — the human-readable node name
- service.name — the owning service
Use these to pivot to the Node view, to a specific pod, or to correlate with other signals from the same host.
OTHER
Extra attributes — most importantly the pattern.hash, which is the cluster this specific log line belongs to.
Show similar messages
At the bottom of the panel, the Show similar messages button takes you straight to every other log line that matches this same pattern — with the count right on the button (e.g., 273,128 other occurrences in the example).
This is the button that turns a one-off log line into a pattern-scoped investigation. Click it and you're looking at every log in the time range with the same pattern.hash. Reverse the workflow — start in Patterns View, drill into any pattern, see its members — and you have the full cycle.
Log Sources — Container vs Application
CodeXray distinguishes between two kinds of logs a service can emit. When a service has both enabled, the Source selector in the left filter panel lets you switch between them without leaving the page.
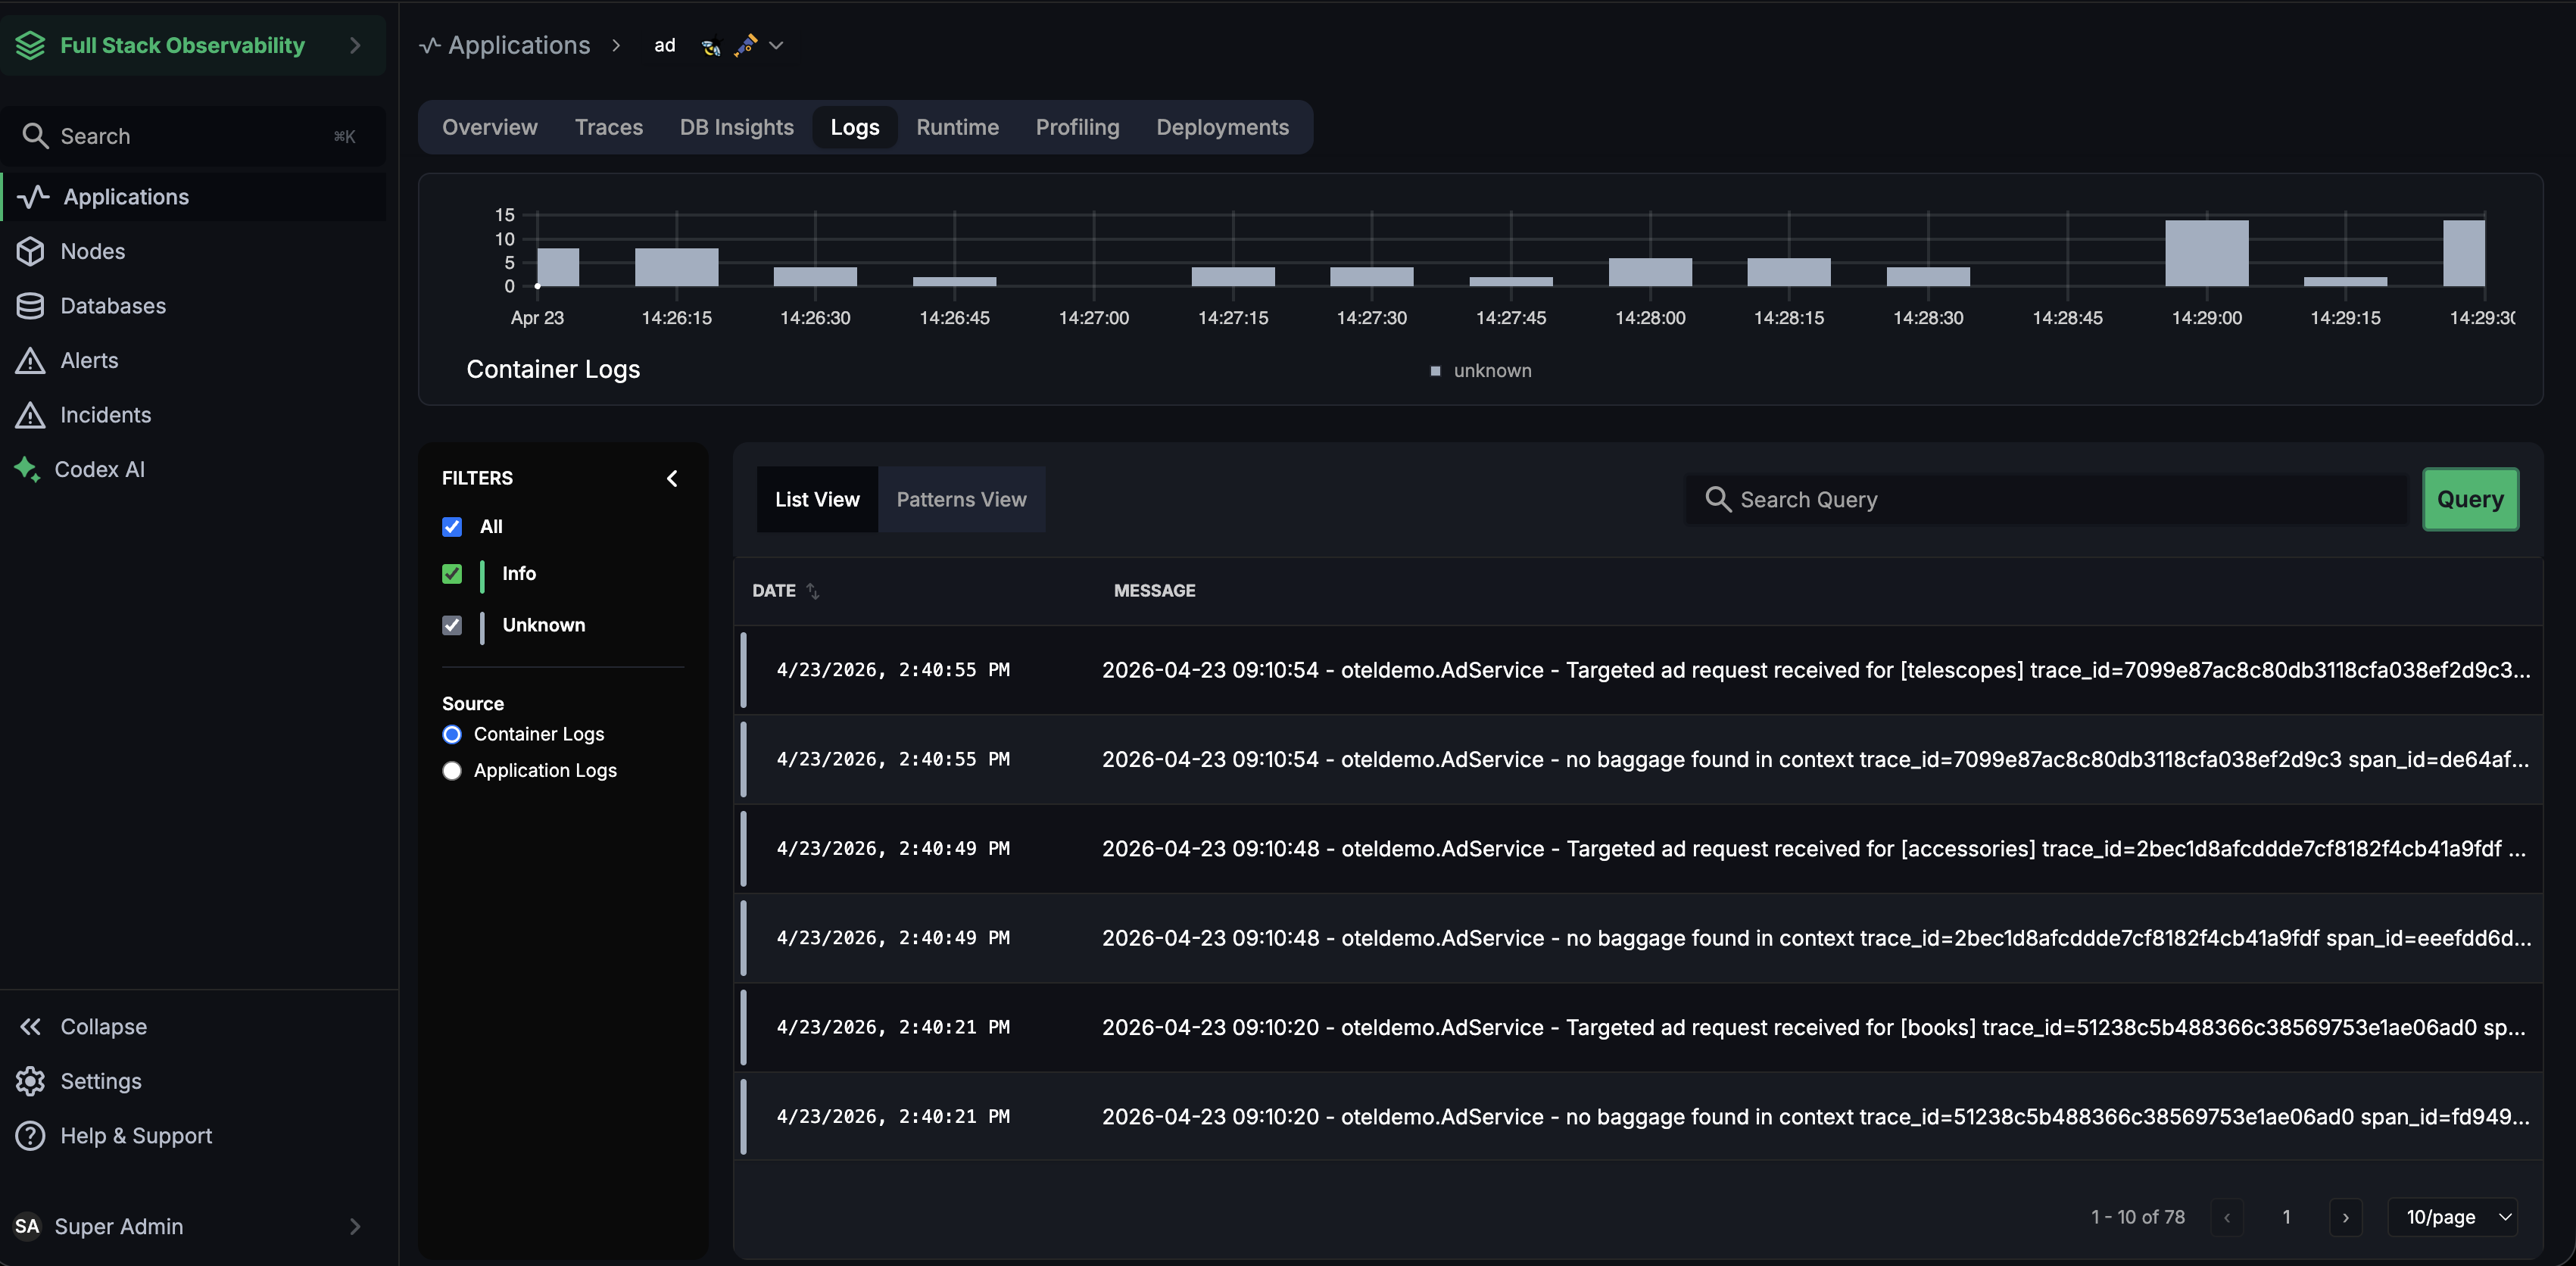
Container Logs
Everything your container writes to stdout / stderr — captured by the CodeXray Node Agent from the host's container runtime (Docker JSON driver, containerd CRI, journald, or /var/log files).
- Always available for any service running on a host with the Node Agent, even with zero application-side changes.
- Covers logs from the app, plus anything the language runtime, init system, or sidecar writes.
- Best for infrastructure and runtime investigations — startup errors, crashes, health-check output, anything emitted before the app's own logger is initialised.
Application Logs
Logs emitted by your application directly through the OpenTelemetry SDK (OTLP logs). These arrive already structured, already carrying severity, and — critically — already carrying the trace context (trace_id, span_id) that ties each log line to the request that produced it.
- Requires the service to use the OpenTelemetry SDK or an equivalent OTLP logger.
- Structured attributes flow through to the detail panel — custom fields your app sets are preserved.
- Best for application-logic investigations — business rules, request-scoped failures, anything tied to a specific trace or span.
When you'll see the Source selector
| Service setup | What appears |
|---|---|
| Node Agent only (no SDK logs) | Container Logs only — no Source selector |
| OpenTelemetry SDK only (no Node Agent) | Application Logs only — no Source selector |
| Both enabled | Source selector — Container Logs (default) / Application Logs |
Container Logs give you the widest safety net — if your app crashes before its logger starts, you'll still see it. Application Logs give you the richest correlation — every line links straight to the matching trace. Enabling both gives investigators a choice at runtime, without duplicating ingest for a service that only needs one.
Common Workflows
Three scenarios that cover most day-to-day log investigation:
"I see an error spike on the time-series chart — what caused it?"
- Filter severity to Error only.
- Zoom the time range to cover just the spike.
- Switch to Patterns View — the new pattern (or the pattern with a sudden count jump) is almost always the cause.
- Click into the pattern, open one example, and use Show similar messages to see everything that matched.
"What are the top recurring errors in this service this week?"
- Set the time range to the last 7 days.
- Filter to Error only.
- Patterns View — the top 3–5 patterns are your candidate fixes. The percentage column tells you which ones are worth a fix first.
"I see a suspicious log line — where exactly did it come from?"
- Click the row to open the Log Detail Panel.
- Read SERVICE & INFRASTRUCTURE — that's your container, host, and service.
- Copy
host.nameorcontainer.idto pivot to the Nodes view or the specific pod.
Next Steps
- Overview — the concepts behind log monitoring (sources, pattern extraction, storage)
- CodeXray Node Agent — the agent that discovers container logs and does pattern extraction on the node
- Database Insights — the sibling workflow for database queries inside an application view