Instances — Deployments
The Deployments tab on every application page gives you a release timeline for the service — every change you've shipped, detected automatically from container image/tag transitions, each scored against the deployment before it. If a release makes p99 latency worse, memory usage grow, or log errors spike, the Deployments tab calls it out in plain language.
No waiting to see if alerts fire. Push a release, come here, and CodeXray tells you what changed — for better or worse — against the baseline of the previous deploy.
Where to Find It
Applications → service → Deployments tab.
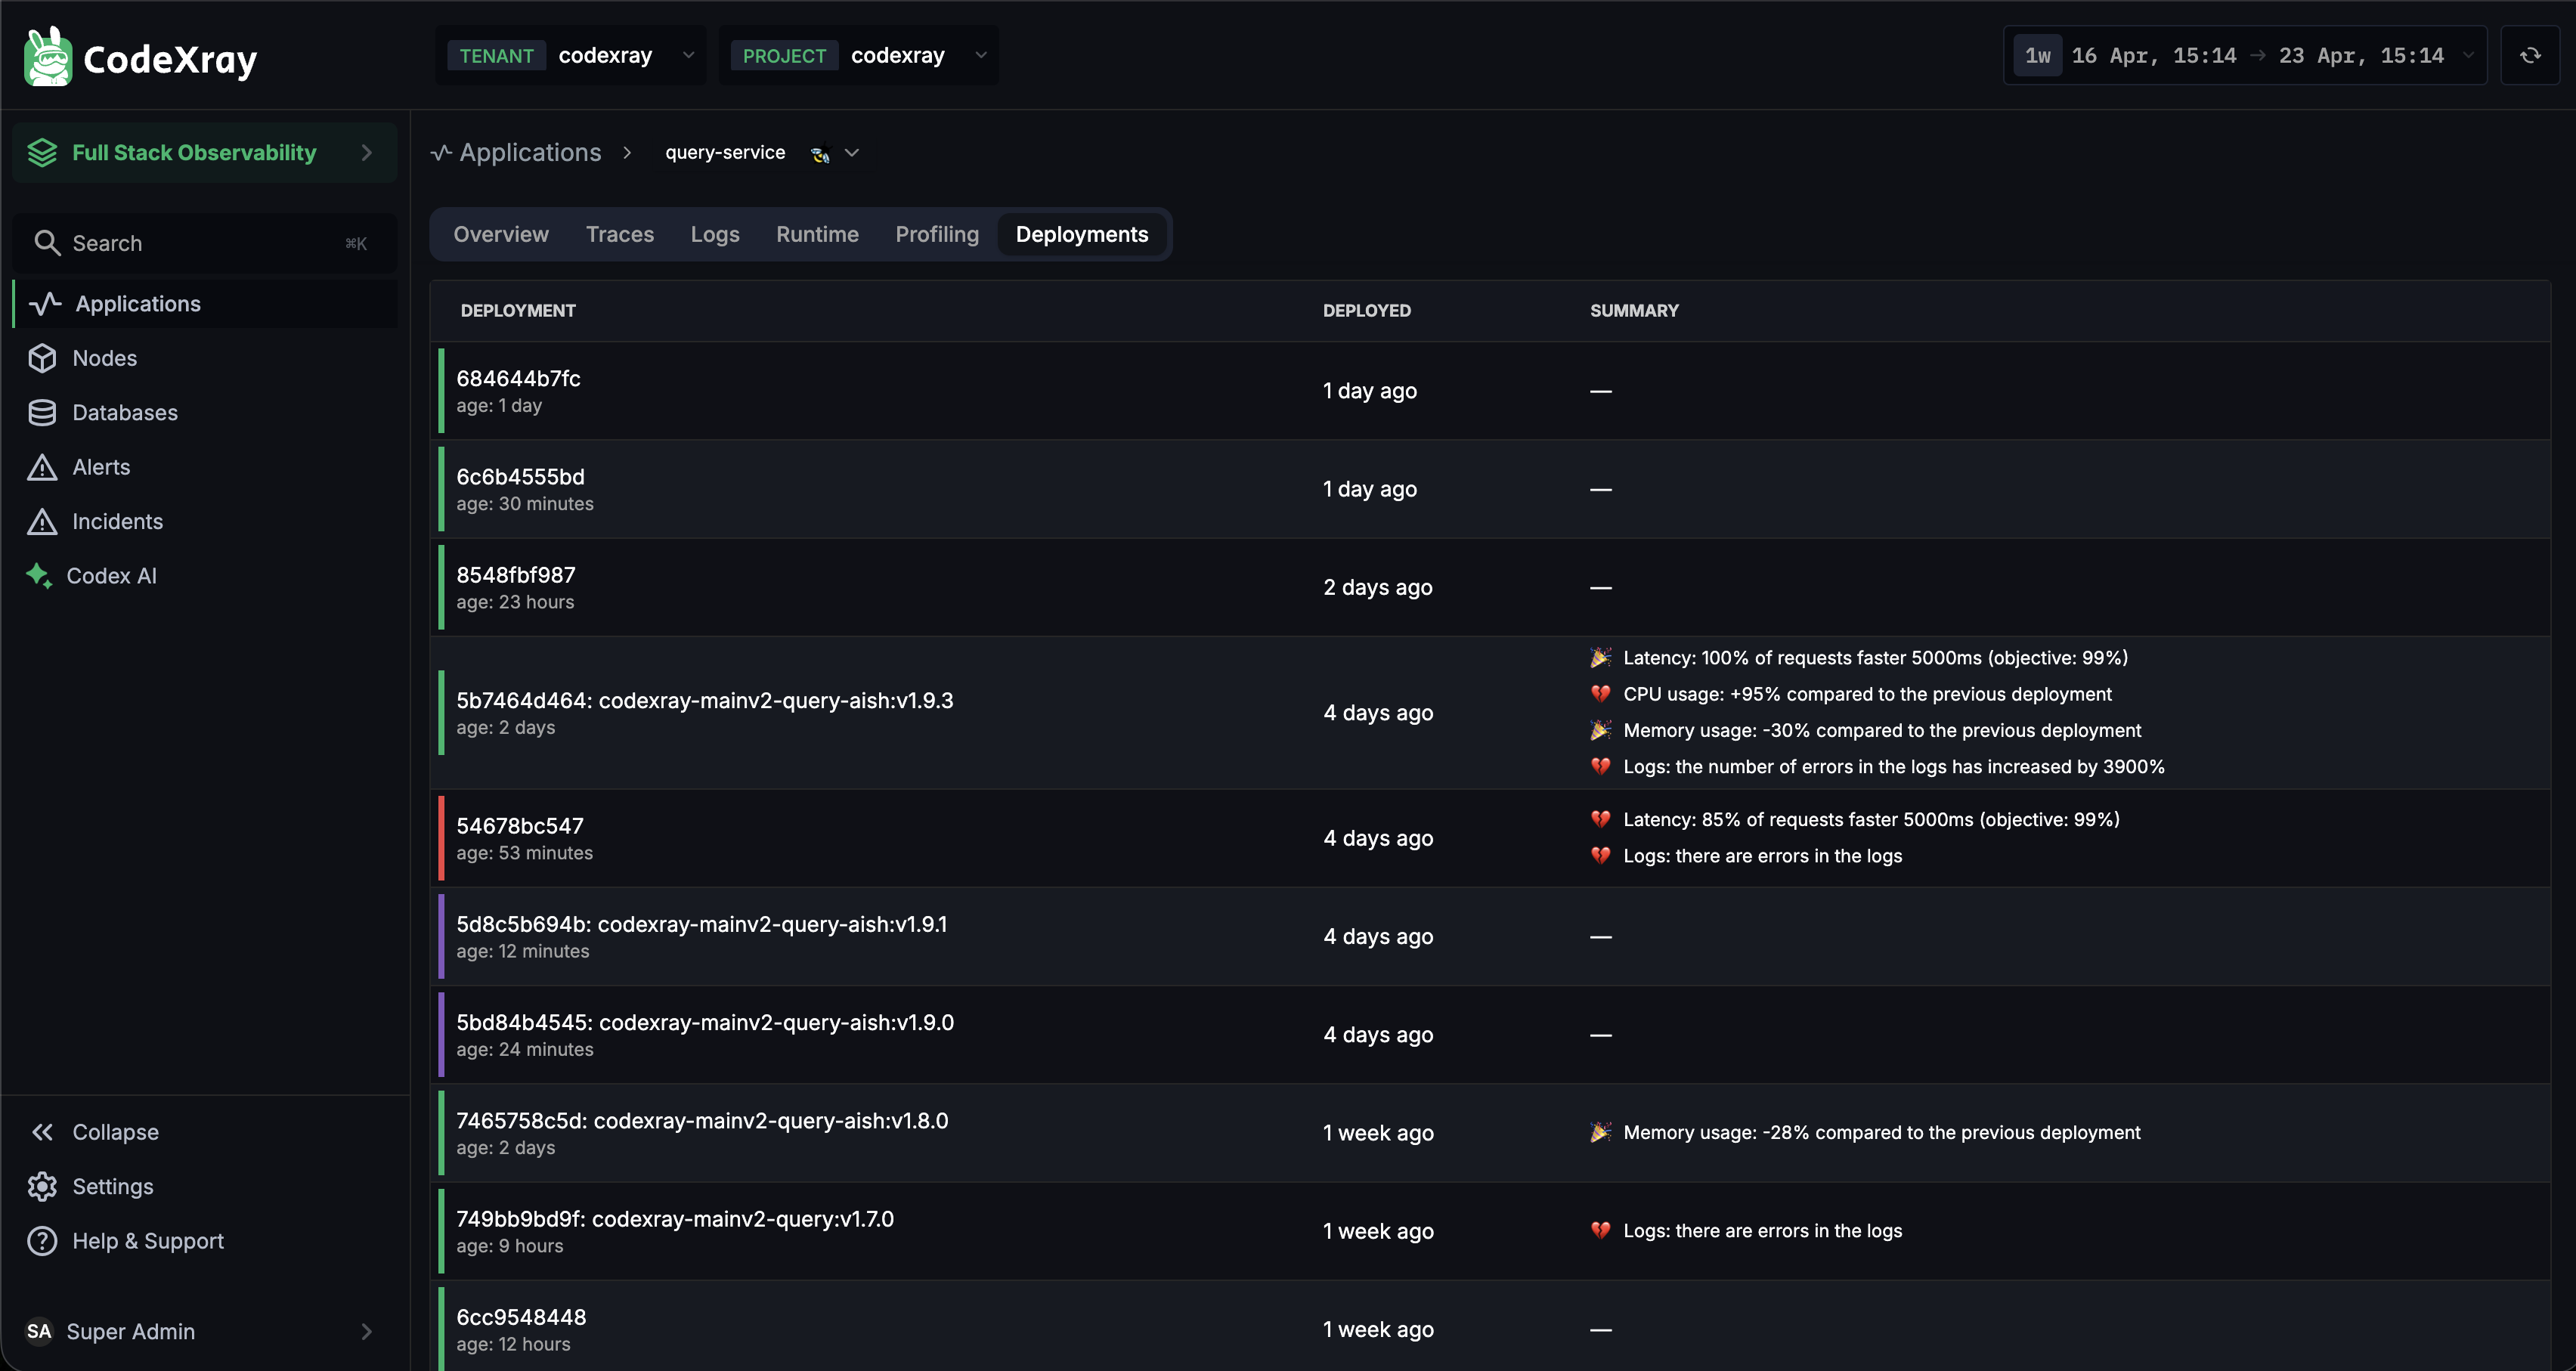
What's on the Page
Each row represents one deployment CodeXray detected for this service. Rows are newest-first.
Columns
| Column | Contents |
|---|---|
| DEPLOYMENT | A coloured bar (status indicator), the deployment hash (short commit-style ID), the image tag (e.g., codexray-mainv2-query-aish:v1.9.3), and an age (age: 4 days) |
| DEPLOYED | Relative time of the rollout (1 day ago, 4 days ago, 1 week ago) |
| SUMMARY | Auto-generated summary of what changed compared to the previous deployment — see below |
The left-side status colour
The thin vertical bar at the left of each row reflects the deployment's impact:
- Green — no regressions; this release made things same-or-better
- Yellow — one or more signals degraded within acceptable bounds
- Red — significant regression detected (latency, CPU, memory, or errors)
Useful for a quick scan: red stripes are the releases you want to look at first.
The Auto-Generated Summary
This is what makes the Deployments tab different from a plain Git log. For every release, CodeXray compares post-deployment behaviour against a baseline window from the previous deployment and flags what changed. A summary line can include:
- 🟢 Latency: 100% of requests faster 5000ms (objective: 99%) — SLO met
- 🔴 Latency: 85% of requests faster 5000ms (objective: 99%) — SLO missed after this release
- 🔴 CPU usage: +95% compared to the previous deployment
- 🟢 Memory usage: -30% compared to the previous deployment
- 🔴 Memory usage: -28% compared to the previous deployment (regression can be negative if it's dropping unexpectedly)
- 🔴 Logs: the number of errors in the logs has increased by 3900%
- 🔴 Logs: there are errors in the logs
—(em-dash) — no notable change; release was clean
Regressions are called out with contextual icons so a scan across the page surfaces problematic releases in seconds.
How CodeXray Detects Deployments
CodeXray spots deployments automatically — no webhook, no CI integration required:
- Kubernetes workloads — new ReplicaSet / new pod template hash triggers a deployment event
- Docker / systemd workloads — container image digest change or service restart with a different image tag
- Bare processes — binary hash change detected by the Node Agent
Each deployment carries the image or binary tag so you know exactly which build is running.
How the Summary Analysis Works
For every deployment, CodeXray selects a baseline window (usually the stable period just before the release) and a comparison window (the period just after) and runs targeted comparisons:
| Signal | What's compared | Regression threshold |
|---|---|---|
| Latency | Share of requests meeting the SLO | SLO miss detected |
| CPU usage | Mean per-instance CPU in the window | Notable delta vs previous (typically >15%) |
| Memory usage | Mean per-instance RSS in the window | Notable delta vs previous |
| Log errors | Error-severity log volume | Statistically significant increase |
You'll see only the signals that have a meaningful change — the page doesn't add noise for "CPU went from 4.1% to 4.2%". Clean releases get a simple em-dash summary.
Common Workflows
"I just deployed — did it hurt anything?"
Open the Deployments tab. Your release is on top. The summary column tells you in one line whether anything regressed. If red: expand the deploy (not shown; click the row in the UI) to see the full breakdown per signal.
"Was that incident last Tuesday a deploy?"
Scroll back to the relevant time. If there's a red-striped deployment at that point, that's your prime suspect. Cross-reference with the Overview chart (requests / errors) for the same time window.
"Which releases have been dropping user-visible performance?"
Scan the left-column stripe colour. Yellow and red releases are your candidates. You can triage a week's worth of releases in 30 seconds without leaving the page.
"My release was clean — why don't I see any summary?"
An em-dash (—) in the summary means "no regression detected". That's the outcome you want. If you'd like the page to explicitly confirm improvements (e.g., "latency -20%"), those call-outs appear too when the improvement crosses the detection threshold.
What Feeds This View
- Deployment detection — Kubernetes ReplicaSets, Docker/Containerd image tag changes, systemd unit restarts, binary digest changes — all seen by the Node Agent and Cluster Agent
- Regression analysis — the CodeXray backend compares metrics across windows before and after each detected deploy
- Log signals — pattern-level counts from the log-parsing pipeline (Log Monitoring)
No configuration required on your side — detection and analysis are automatic.
Next Steps
- Overview — the application landing page (includes a
RESTARTSKPI) - CPU and Memory — pair with Deployments to investigate a flagged regression
- Log Monitoring — used to detect log-error regressions across deployments