Instances — Memory
The Runtime → Memory tab on every application page shows how each instance of the service is using memory — and how it shares the node with other containers. Open this page when the Overview shows rising memory, when you're investigating an OOM kill, or when a service just isn't being nice about its memory footprint.
- How much memory is each instance using right now, and is it growing?
- Are we at risk of hitting the memory limit and getting OOM-killed?
- Is the node we're running on under memory pressure?
- Which other containers on the same node are competing for memory?
Where to Find It
Applications → service → Runtime tab → Memory (left sidebar inside the tab).
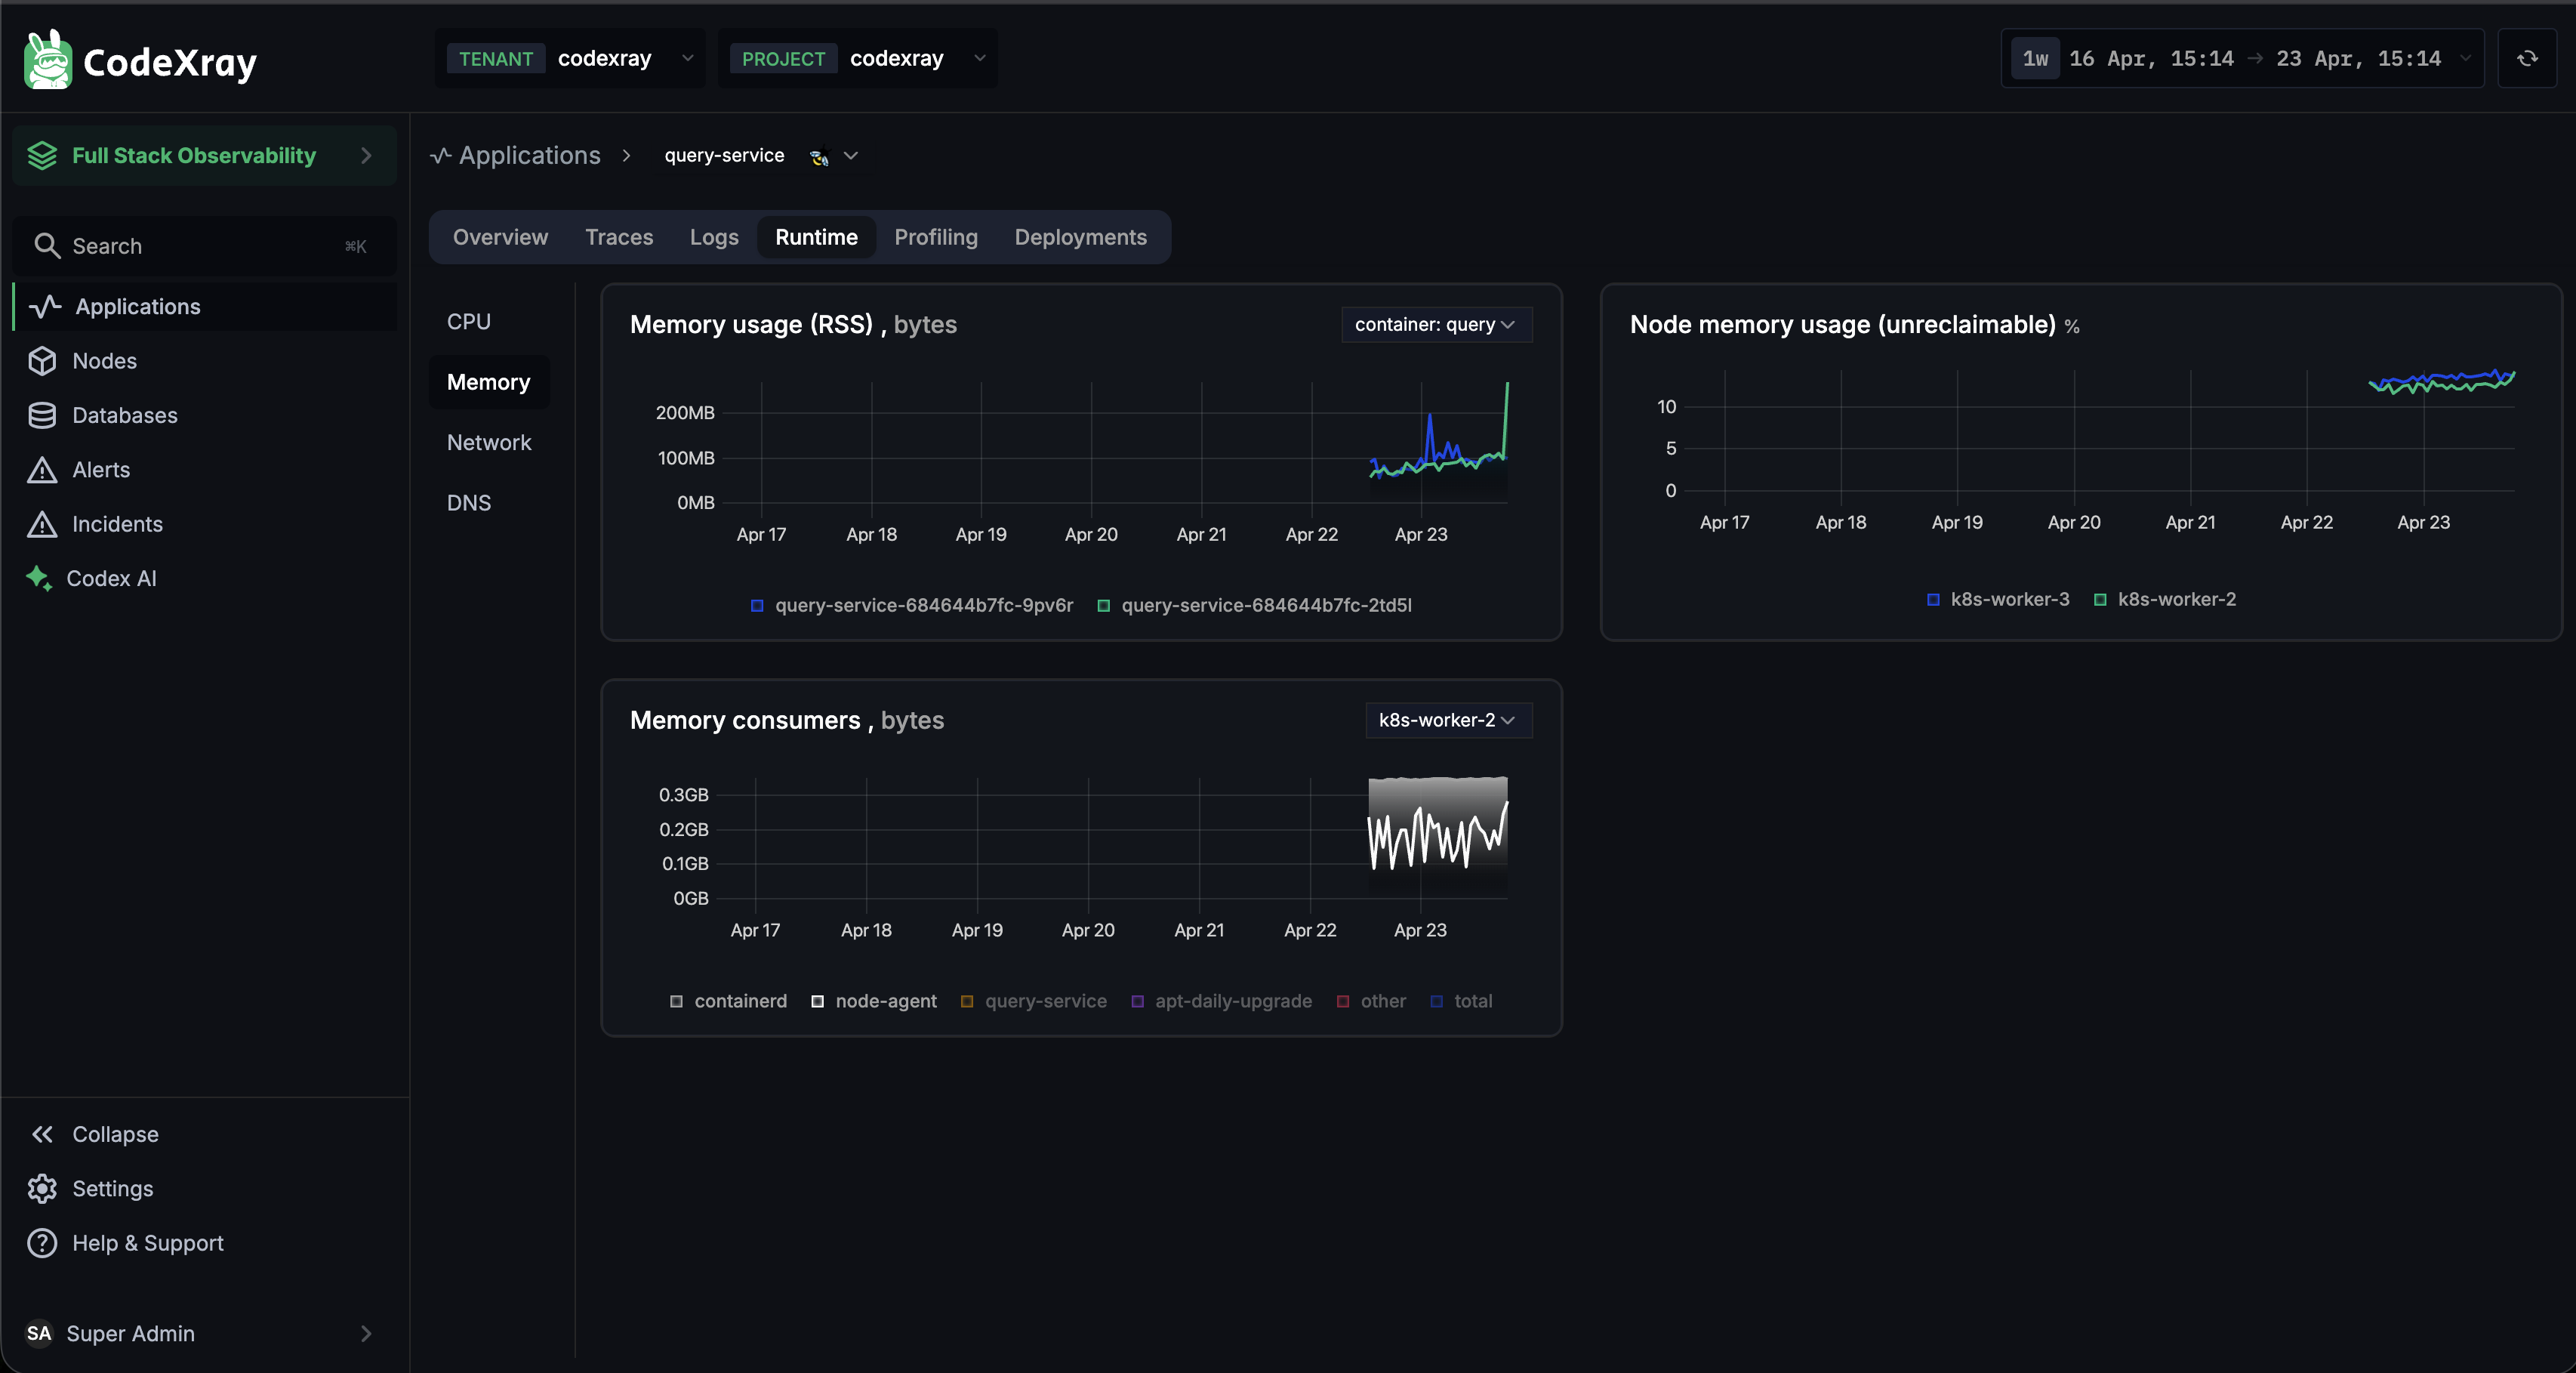
The Memory sub-view is one level deeper than the Overview — use Overview for the quick "are we OK?" check, and this page when the answer is "maybe not".
What's on the Page
Three charts cover memory from the container level up to the node level.
1. Memory usage (RSS, bytes)
Resident Set Size per-instance — the physical memory each pod/container currently holds. Every series is one pod (query-service-684644b7fc-9pv6r, query-service-684644b7fc-2td5i). Use this as the primary memory-health signal for a service.
What to look for:
- Flat line — steady-state, no leak. Good.
- Sustained upward trend — memory leak suspected, or the service's working set is growing.
- Sawtooth pattern — GC or cache eviction is doing its job; the peaks indicate memory pressure but the service is coping.
- Wide spread between replicas — bad work distribution, or one pod has a cached dataset the others don't.
2. Node memory usage (unreclaimable, %)
The percentage of memory on the node that is unreclaimable — active memory that can't be freed under pressure. This is a better indicator of real memory pressure than "total used memory", which includes page cache the kernel can drop at any time.
Rule of thumb: when this climbs past ~80% and stays there, you're near the danger zone. At 95%+, OOM kills are imminent.
3. Memory consumers (bytes)
A stacked area chart of every container on the selected node, grouped and colour-coded by container name, plus a total line on top. At a glance this tells you:
- Which containers are responsible for memory use on the node
- Whether your service is dominating, or a neighbour is
- Whether the
totalis approaching the node's physical memory
Your service shows up as one coloured band; the others are neighbours. An other and node-agent band appear too — the sum gives you a full accounting of where RAM is going on that host.
Common Workflows
"Am I leaking memory?"
Look at Memory usage (RSS) across the widest time window you have (7d, 30d). A straight upward line that doesn't drop on container restart = a leak in your app; a line that resets to a lower baseline on restart = likely a cache that's hot but bounded. Pair with Profiling to find the function allocating the leaked memory.
"Why did my container get OOM-killed?"
- Check Memory usage (RSS) around the time of the kill — was the container close to its limit?
- Check Node memory usage (unreclaimable) at the same time — was the node over-committed?
- OOM is either a container limit breach (raise the limit or fix the leak) or a node OOM killer choosing your pod because the node itself ran out of memory (check the noisy-neighbour section below).
"Is my node a noisy neighbour?"
Look at Memory consumers — the stacked chart. If a container you don't own is dominating the node's memory, you're a victim of bad pod placement. Flag it to whoever owns that workload, or apply Kubernetes anti-affinity rules to keep your critical services separate from greedy neighbours.
"Are my memory limits set right?"
Compare typical Memory usage (RSS) to your Pod's memory limit:
- If peaks routinely approach the limit → raise it or fix the workload
- If usage never exceeds 40% of the limit → lower it, improve bin-packing
What Feeds This View
- Container RSS — from the Linux memory cgroup (
memory.stats) via the Node Agent - Node memory (unreclaimable) — derived from
/proc/meminfo(MemTotal - MemAvailable - buffers - cached≈ unreclaimable) - Memory consumers on the node — aggregated cgroup metrics across all containers on the host
All collected automatically by the Node Agent — zero application-side setup.
Next Steps
- CPU — the sibling Runtime view for CPU
- Network — outbound connection map and TCP health
- DNS — domain-resolution latency and errors
- Overview — the application landing page (includes the
MEMORYandOOM RISK STATUScards) - Profiling Overview — heap profiles for Go and other languages (when you need to find which function allocated the memory)