Instances — CPU
The Runtime → CPU tab on every application page shows how each instance of the service is consuming CPU — and what it's competing with on its node. It's the page you open when an Overview CPU gauge looks hot, or when a service is slow and you need to rule in (or rule out) CPU saturation.
- Is any instance of this service close to its CPU limit?
- Are we being throttled by the kernel?
- Is the node itself overloaded?
- Which containers on the same node are competing for CPU with this service?
Where to Find It
Applications → service → Runtime tab → CPU (left sidebar inside the tab).
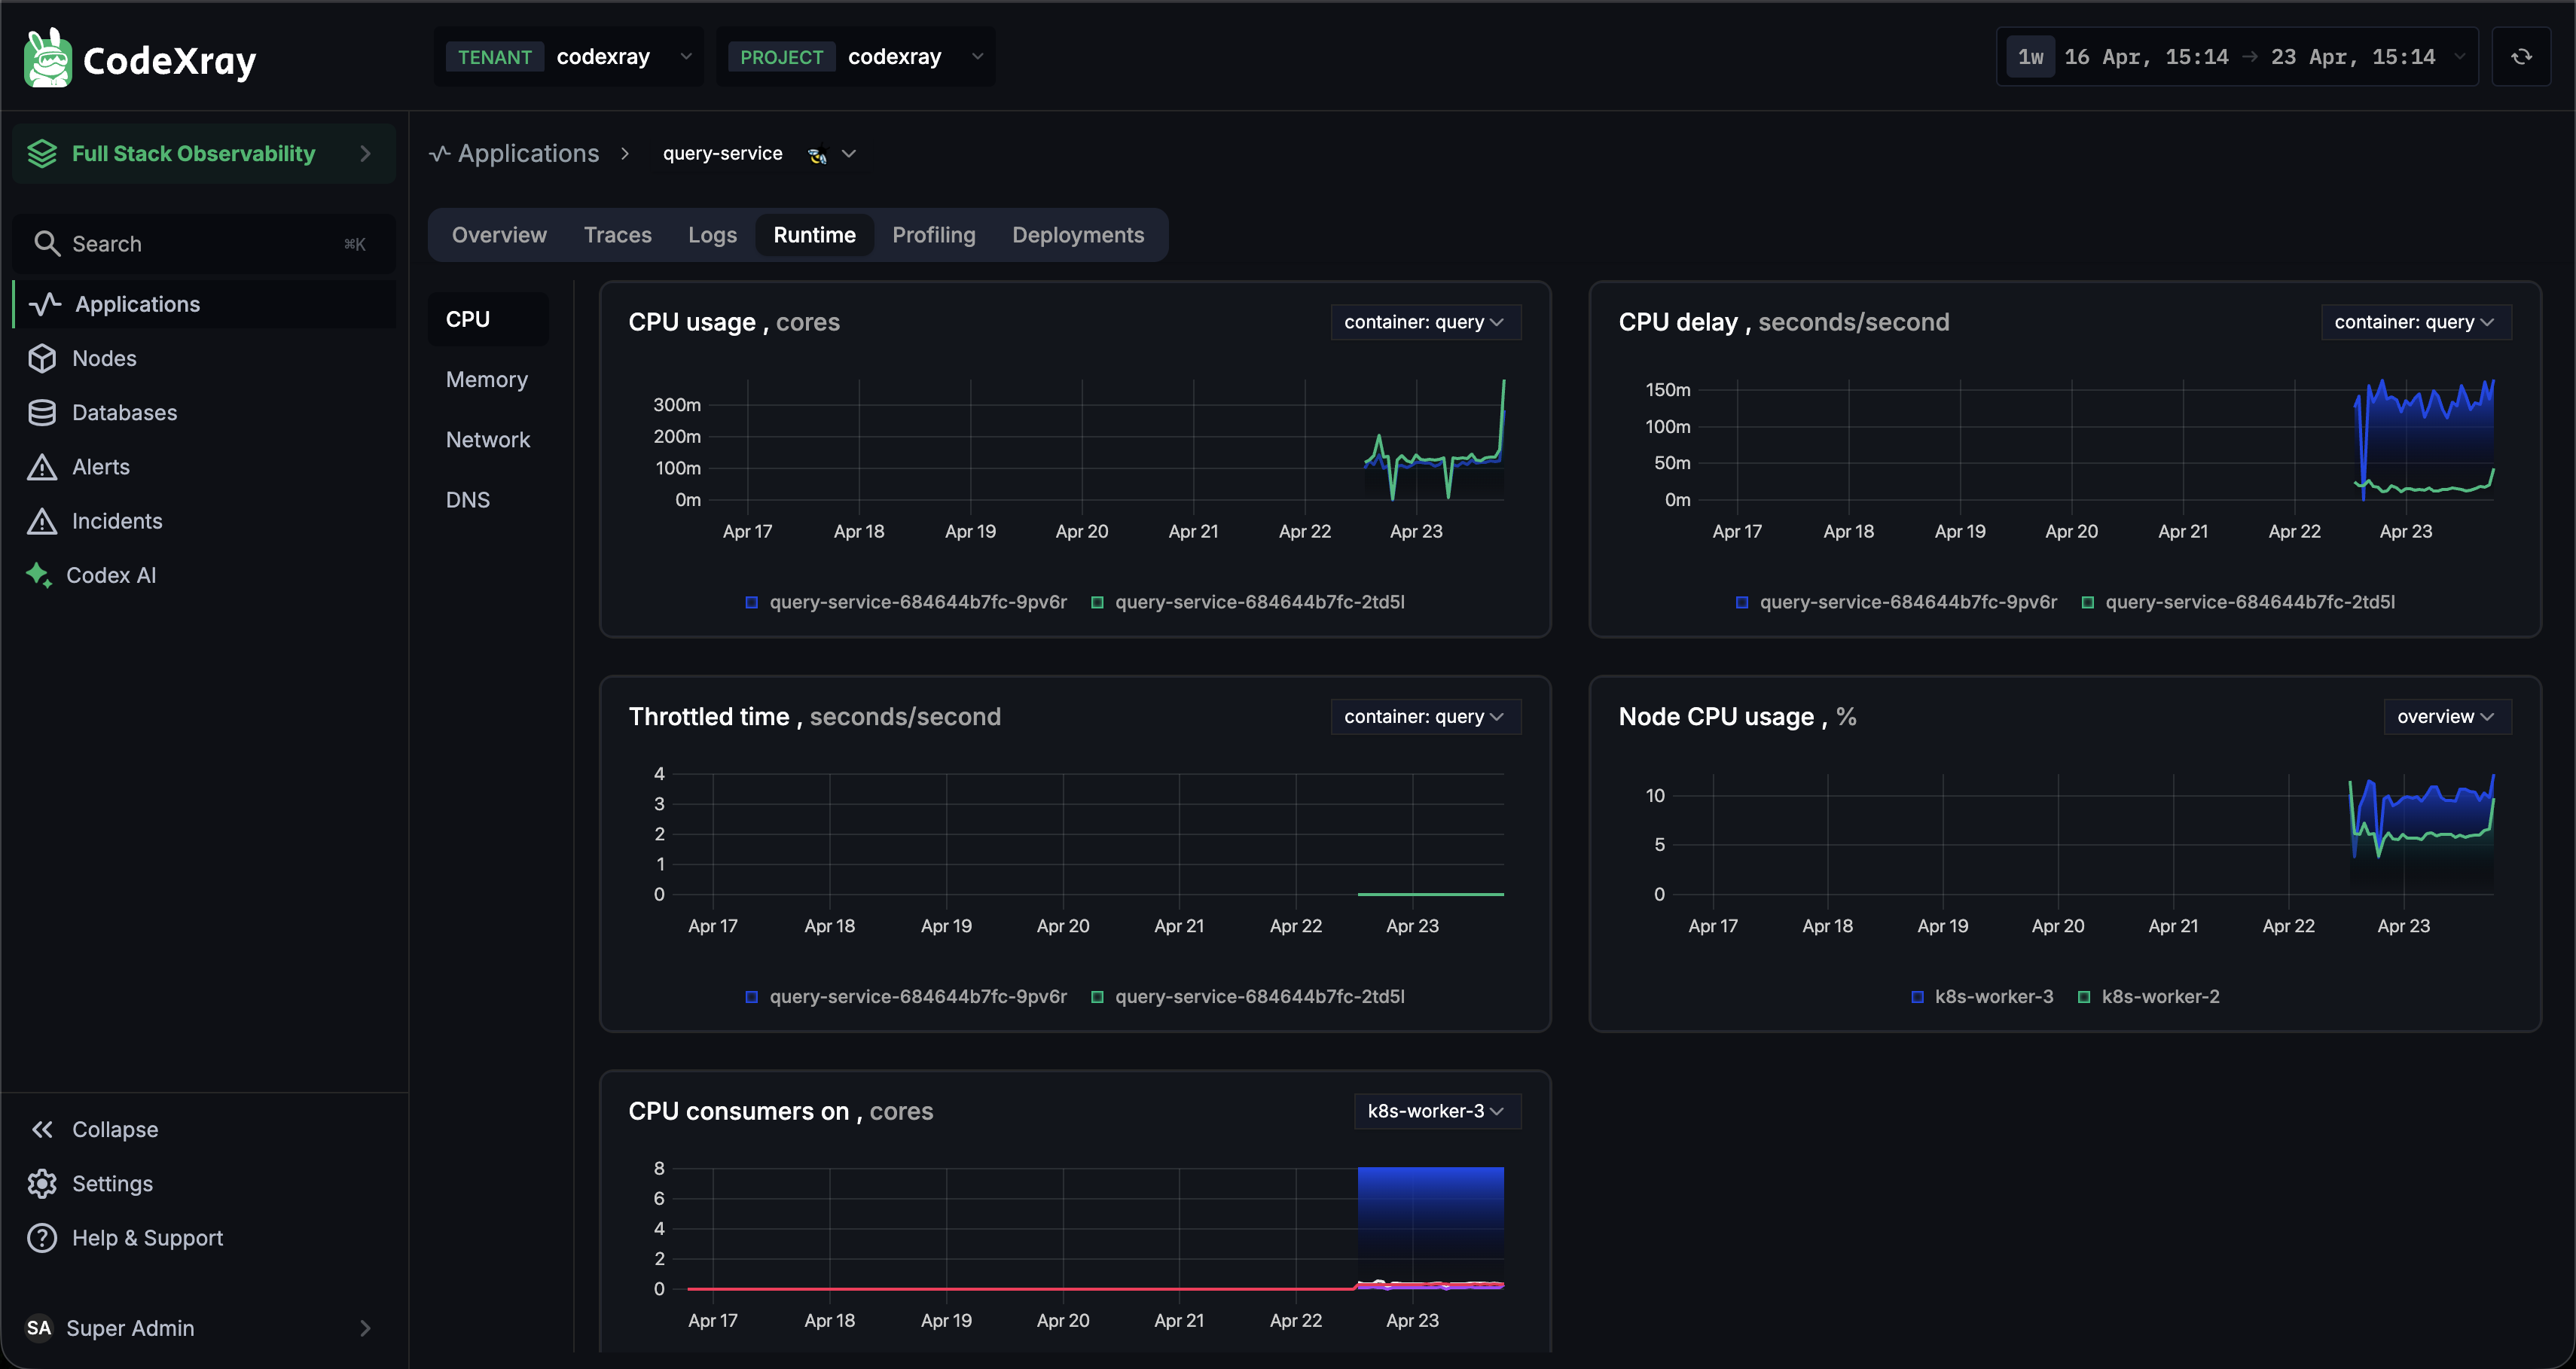
The Runtime tab has its own inner sidebar with sub-views (CPU, Memory, Network, DNS). This page covers the CPU sub-view.
What's on the Page
Five charts cover CPU from the container level up to the node level. All charts have a container selector at the top-right so you can scope to one container or see them all at once.
1. CPU usage (cores)
Per-instance CPU consumption over time, in cores. Each series is one pod/container of the service (e.g., query-service-684644b7fc-9pv6r, query-service-684644b7fc-2td5i). Compare instances to spot hot pods — an imbalanced load indicates noisy work, a bad scheduler decision, or per-instance contention.
2. CPU delay (seconds/second)
The hidden signal most APM tools miss. CPU delay is the time a process was runnable but waiting for a CPU — it's captured by the Linux delay-accounting subsystem and surfaced by the CodeXray Node Agent. A spike here means the container wanted to run but couldn't get CPU time — often a far better symptom of CPU pressure than raw utilisation.
A few rules of thumb:
- Delay trending up while usage is flat → the CPU is contended somewhere else; the container wants more but isn't getting it
- Delay AND throttling spiking together → the container is hitting its CFS quota
- Delay spiking per-instance → one pod is worse off than the others; rescheduling or noisy-neighbour investigation
3. Throttle time (seconds/second)
Time the container has been throttled by the Linux CFS scheduler — the kernel's way of enforcing the CPU limit you set in your Pod or Docker spec. Any non-zero throttling means you've hit your CPU limit. A steady trickle over time is a latency killer even if average CPU usage is low, because throttling happens in 100ms chunks.
Throttling can make p99 latency spike by 10× with barely any change to the CPU-usage chart. If p99 latency regressions correlate with throttle-time spikes, lift your CPU limit or disable CFS quota enforcement (on K8s, set resources.limits.cpu appropriately or use static CPU Manager policy for latency-sensitive services).
4. Node CPU usage (%)
Zoom out to the node this service's instances are running on. If the node itself is hot, even a well-behaved container can starve. Multiple nodes are shown as separate series — useful when a service is spread across the cluster.
5. CPU consumers on the node (cores)
The heaviest CPU consumers on the selected node, across all containers — not just this service. Use this to find the noisy neighbour responsible for starving your service, or to confirm your service is the top consumer (and the issue is internal, not external).
Common Workflows
"Is my slowness actually CPU?"
- Check CPU usage — are you near your limit?
- Check Throttle time — is it non-zero? If yes, you're CPU-capped.
- Check CPU delay — is it climbing? If yes, something is denying you CPU.
- If usage is fine + delay is climbing → look at Node CPU usage and CPU consumers on the node. The issue is probably a noisy neighbour, not you.
"Are my replicas evenly loaded?"
Look at CPU usage with all containers visible. Imbalance points at a bad scheduling decision, a sticky session, or an uneven distribution of work by your load balancer.
"Do my CPU limits match reality?"
Compare sustained CPU usage to your limit — if you're routinely hitting it, raise the limit. If you're always at <20% and never hitting it, tighten the request (so the scheduler packs your workload better and your bill drops).
What Feeds This View
- Container CPU metrics — from the Linux cgroup files (
cpuacct.usage,cpu.stat) via the Node Agent - CPU delay — from Linux delay accounting via Netlink, captured by the Node Agent
- Node CPU usage —
/proc/stat - CPU consumers — all containers' cgroup metrics on the same host
Everything is already collected automatically by the Node Agent — no application-side setup required.
Next Steps
- Memory — the sibling Runtime view for memory
- Network — outbound connection map and TCP health
- DNS — domain-resolution latency and errors
- Overview — the application landing page
- Node Agent Metrics — the raw metrics that power these charts