Instances — Network
The Runtime → Network tab shows how each instance of your service is talking to everything else — its peer services, databases, and any external endpoints. Open this page when requests are slow and you suspect the network (or the peer), when connection counts look off, or when you want to confirm the scope and health of a service's dependencies.
- What is this service actually connecting to right now?
- Is the network (or peer) adding latency we can't explain from CPU or memory?
- Are we retransmitting packets — symptom of packet loss or a congested link?
- Is there a connection spike that correlates with my incident?
Where to Find It
Applications → service → Runtime tab → Network (left sidebar inside the tab).
The Connection Map
The top of the page is a live topology of every outbound connection each of this service's instances is making — grouped by the node each instance runs on.
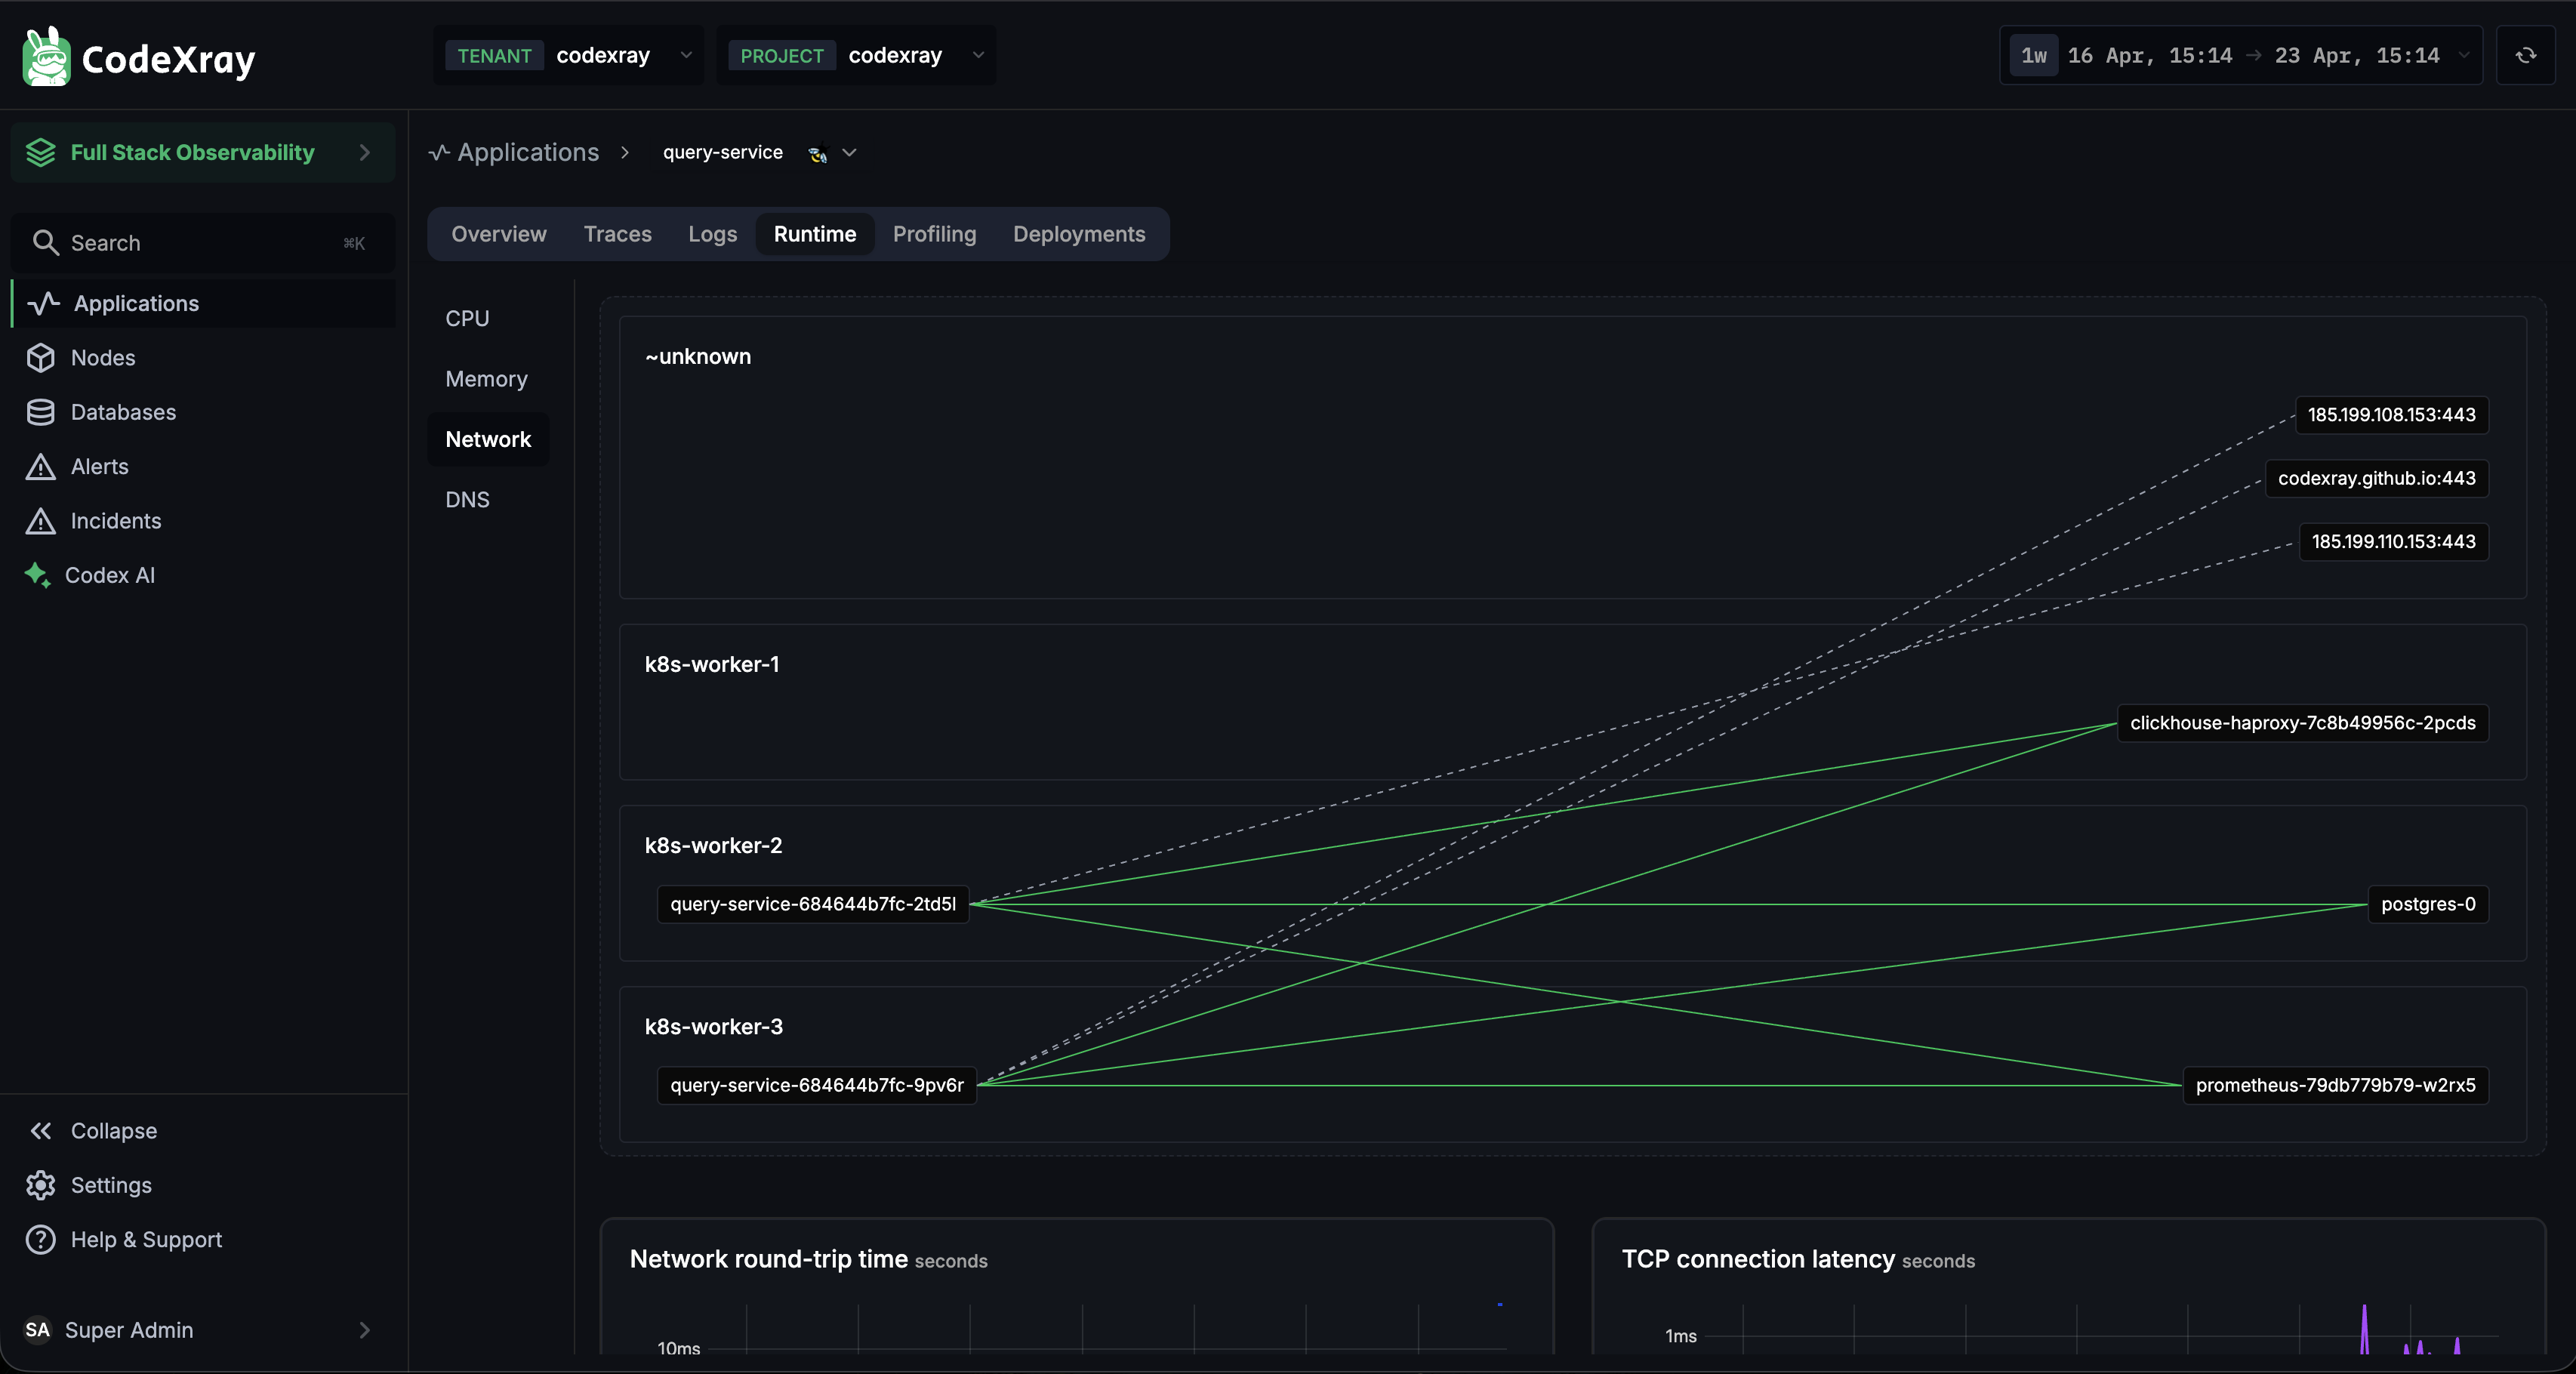
Each box on the left is an instance (like query-service-684644b7fc-9pv6r) plus its host node (k8s-worker-1, k8s-worker-2, k8s-worker-3, or ~unknown for connections to external endpoints). Lines are drawn to each peer the instance is currently talking to — both internal services (postgres-0, clickhouse-haproxy-7c8b49956c-2pcds, prometheus-79db779b79-w2rx5) and external hosts (codexray.github.io:443, IP endpoints like 185.199.108.153:443).
Line styles distinguish:
- Solid green — healthy, active connection
- Dashed grey — an edge observed recently that isn't currently connected (e.g., a just-closed peer)
This is the fastest way to answer "what does this service depend on?" — and it's assembled automatically by the Node Agent using eBPF at the TCP connect() / listen() level, with zero instrumentation.
The Network Charts
Below the connection map, six time-series charts break down network health per peer.
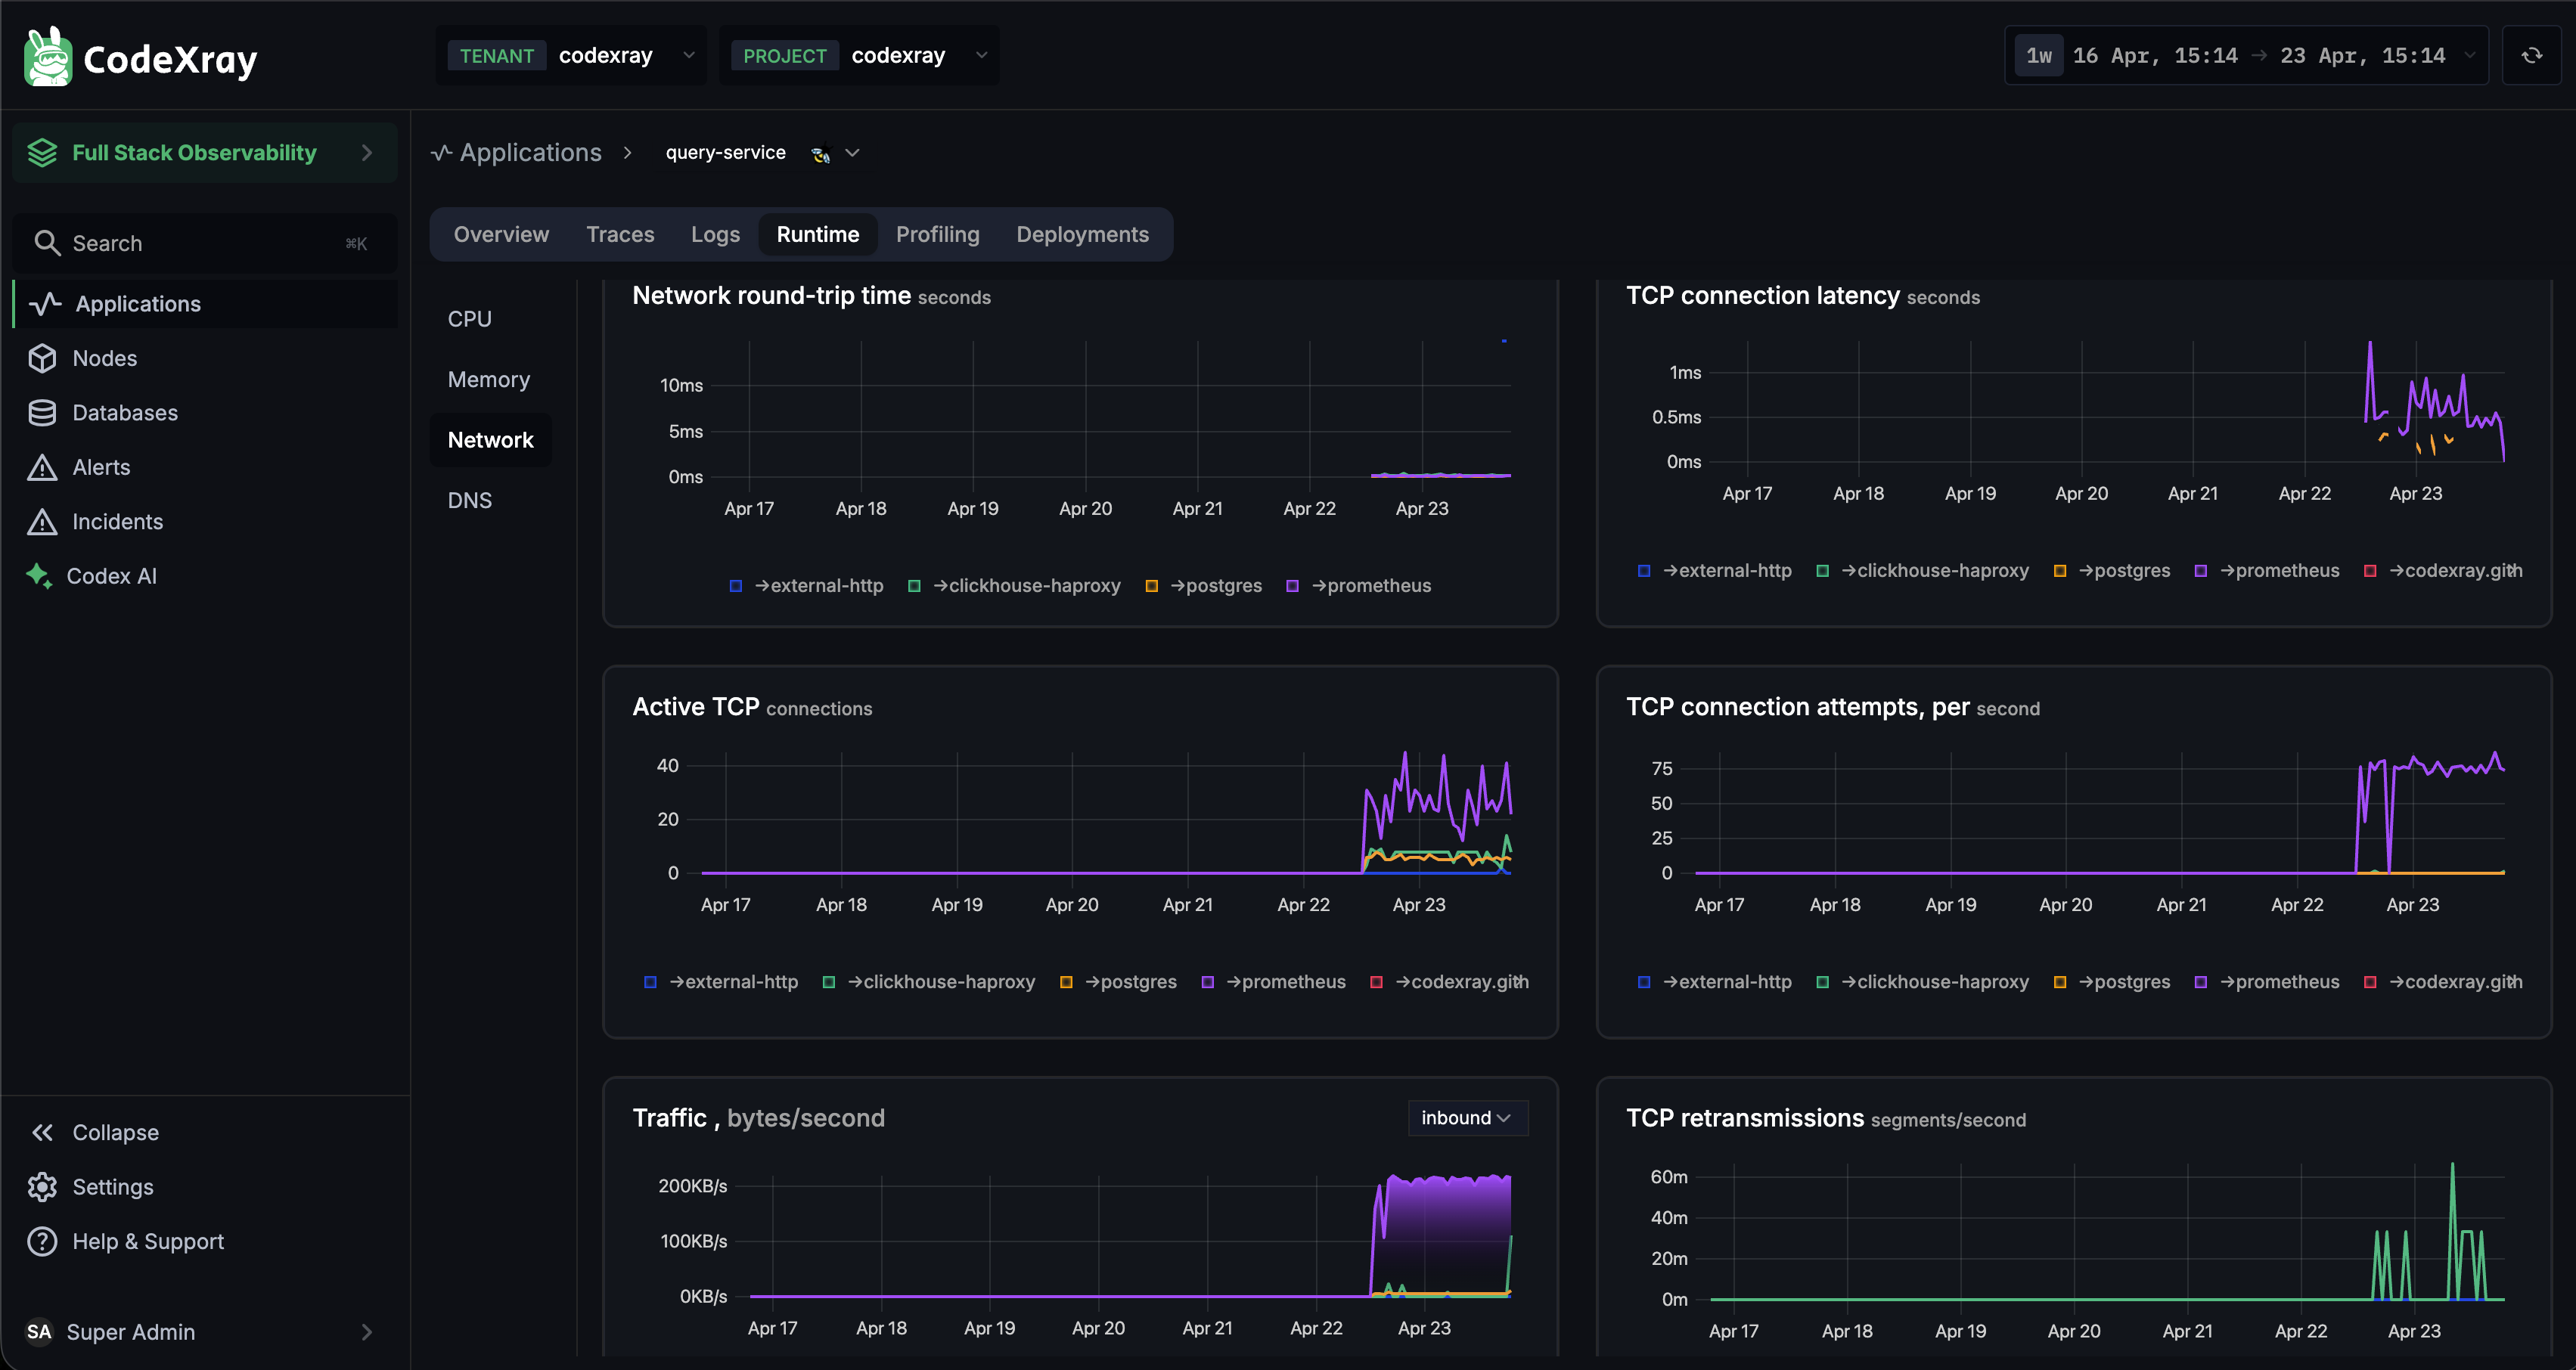
Each chart supports the same per-peer legend — so you can see which dependency is behaving how.
1. Network round-trip time (seconds)
ICMP-measured round-trip time between the container and each remote peer it's talking to. Captured by the Node Agent's pinger. This is pure network latency — independent of what the peer is doing — so a spike here means the network between you and the peer got worse.
2. TCP connection latency (seconds)
Time to establish new TCP connections to each peer (measured at the kernel via eBPF). A spike here that's not reflected in round-trip time usually means the peer is slow to accept new connections — often because its backlog is full or the process is stalled.
3. Active TCP (connections)
The current count of established TCP connections from this service's instances to each peer. Use it to:
- Spot connection pool leaks (steady growth)
- Confirm expected fan-out (e.g., N connections to your DB primary, M to a cache)
- See the impact of a config change (pool size, keep-alive)
4. TCP connection attempts, per second
Rate of new connections being made. Healthy services connect once and reuse the pool — high steady-state connection attempt rates usually mean your connection pool is misconfigured or being recycled too aggressively.
5. Traffic (bytes/second)
Inbound and outbound bytes per second, per peer. Useful for capacity planning and identifying the heaviest traffic paths. The legend lets you filter to a single peer to isolate where the bandwidth is going.
6. TCP retransmissions (segments/second)
Retransmitted TCP segments per peer — captured from the kernel's tcp_retransmit_skb tracepoint. Any non-zero baseline is a signal of packet loss on that path. Correlates with availability-zone jitter, flaky cloud-provider networks, or oversubscribed links. One of the most underused network-health signals.
Common Workflows
"Latency is up but CPU and memory are fine — is it the network?"
- Start with Network round-trip time — any spike there = the network path is worse.
- Check TCP connection latency — if RTT is flat but connection latency is up, it's the peer (not the network) that's slow to accept connections.
- Look at TCP retransmissions — non-zero values mean lossy or congested link; worth raising with your cloud provider or networking team.
"Connection pool is acting weird"
- Active TCP — has the baseline shifted? Up = leak or misconfigured pool; down = peer is refusing connections or the app stopped opening them.
- TCP connection attempts, per second — a sustained high rate with a normal Active TCP count means you're churning connections instead of reusing them.
"I need to see everything this service talks to"
The connection map at the top is that answer — every outbound connection made by any instance in the selected window is drawn there, grouped by node. For a wider service-graph view, use the Topology entry in the main sidebar.
"Did a deploy move us to a different cloud zone?"
Compare the Network round-trip time to each peer before and after the deploy (use the Deployments tab to pinpoint the release). A sudden RTT increase often means your pods got scheduled to a different AZ than the peer — the network cost is real even if latency numbers are single-digit milliseconds.
What Feeds This View
- Connection events — eBPF tracepoint on
sock/inet_sock_set_state— sees every TCPconnect()andlisten()without instrumentation - Round-trip time — the agent pings each active peer IP with ICMP
SO_TIMESTAMPINGenabled, giving sub-millisecond accuracy - Retransmissions — eBPF tracepoint on
tcp/tcp_retransmit_skb - Throughput — eBPF byte counters on the same socket state transitions
- Peer identity — IP addresses are resolved to friendly names via the
ip_to_fqdnmapping the Node Agent builds from observed DNS requests
All collected automatically by the Node Agent. No application-side setup required.
Next Steps
- DNS — the sibling Runtime view for domain-name resolution
- CPU and Memory — pair with Network during incident investigation
- Node Agent Metrics — the raw
container_net_*metrics that power these charts