Redis Monitoring
Redis gets its own view in the Databases module, built around what actually matters for an in-memory key-value store: keyspace and hit ratio, per-command latency, memory and fragmentation, and replication. These are questions a relational "top queries" view can't answer — so Redis has a purpose-built flow.
Open Databases in the sidebar and switch to the Redis tab.
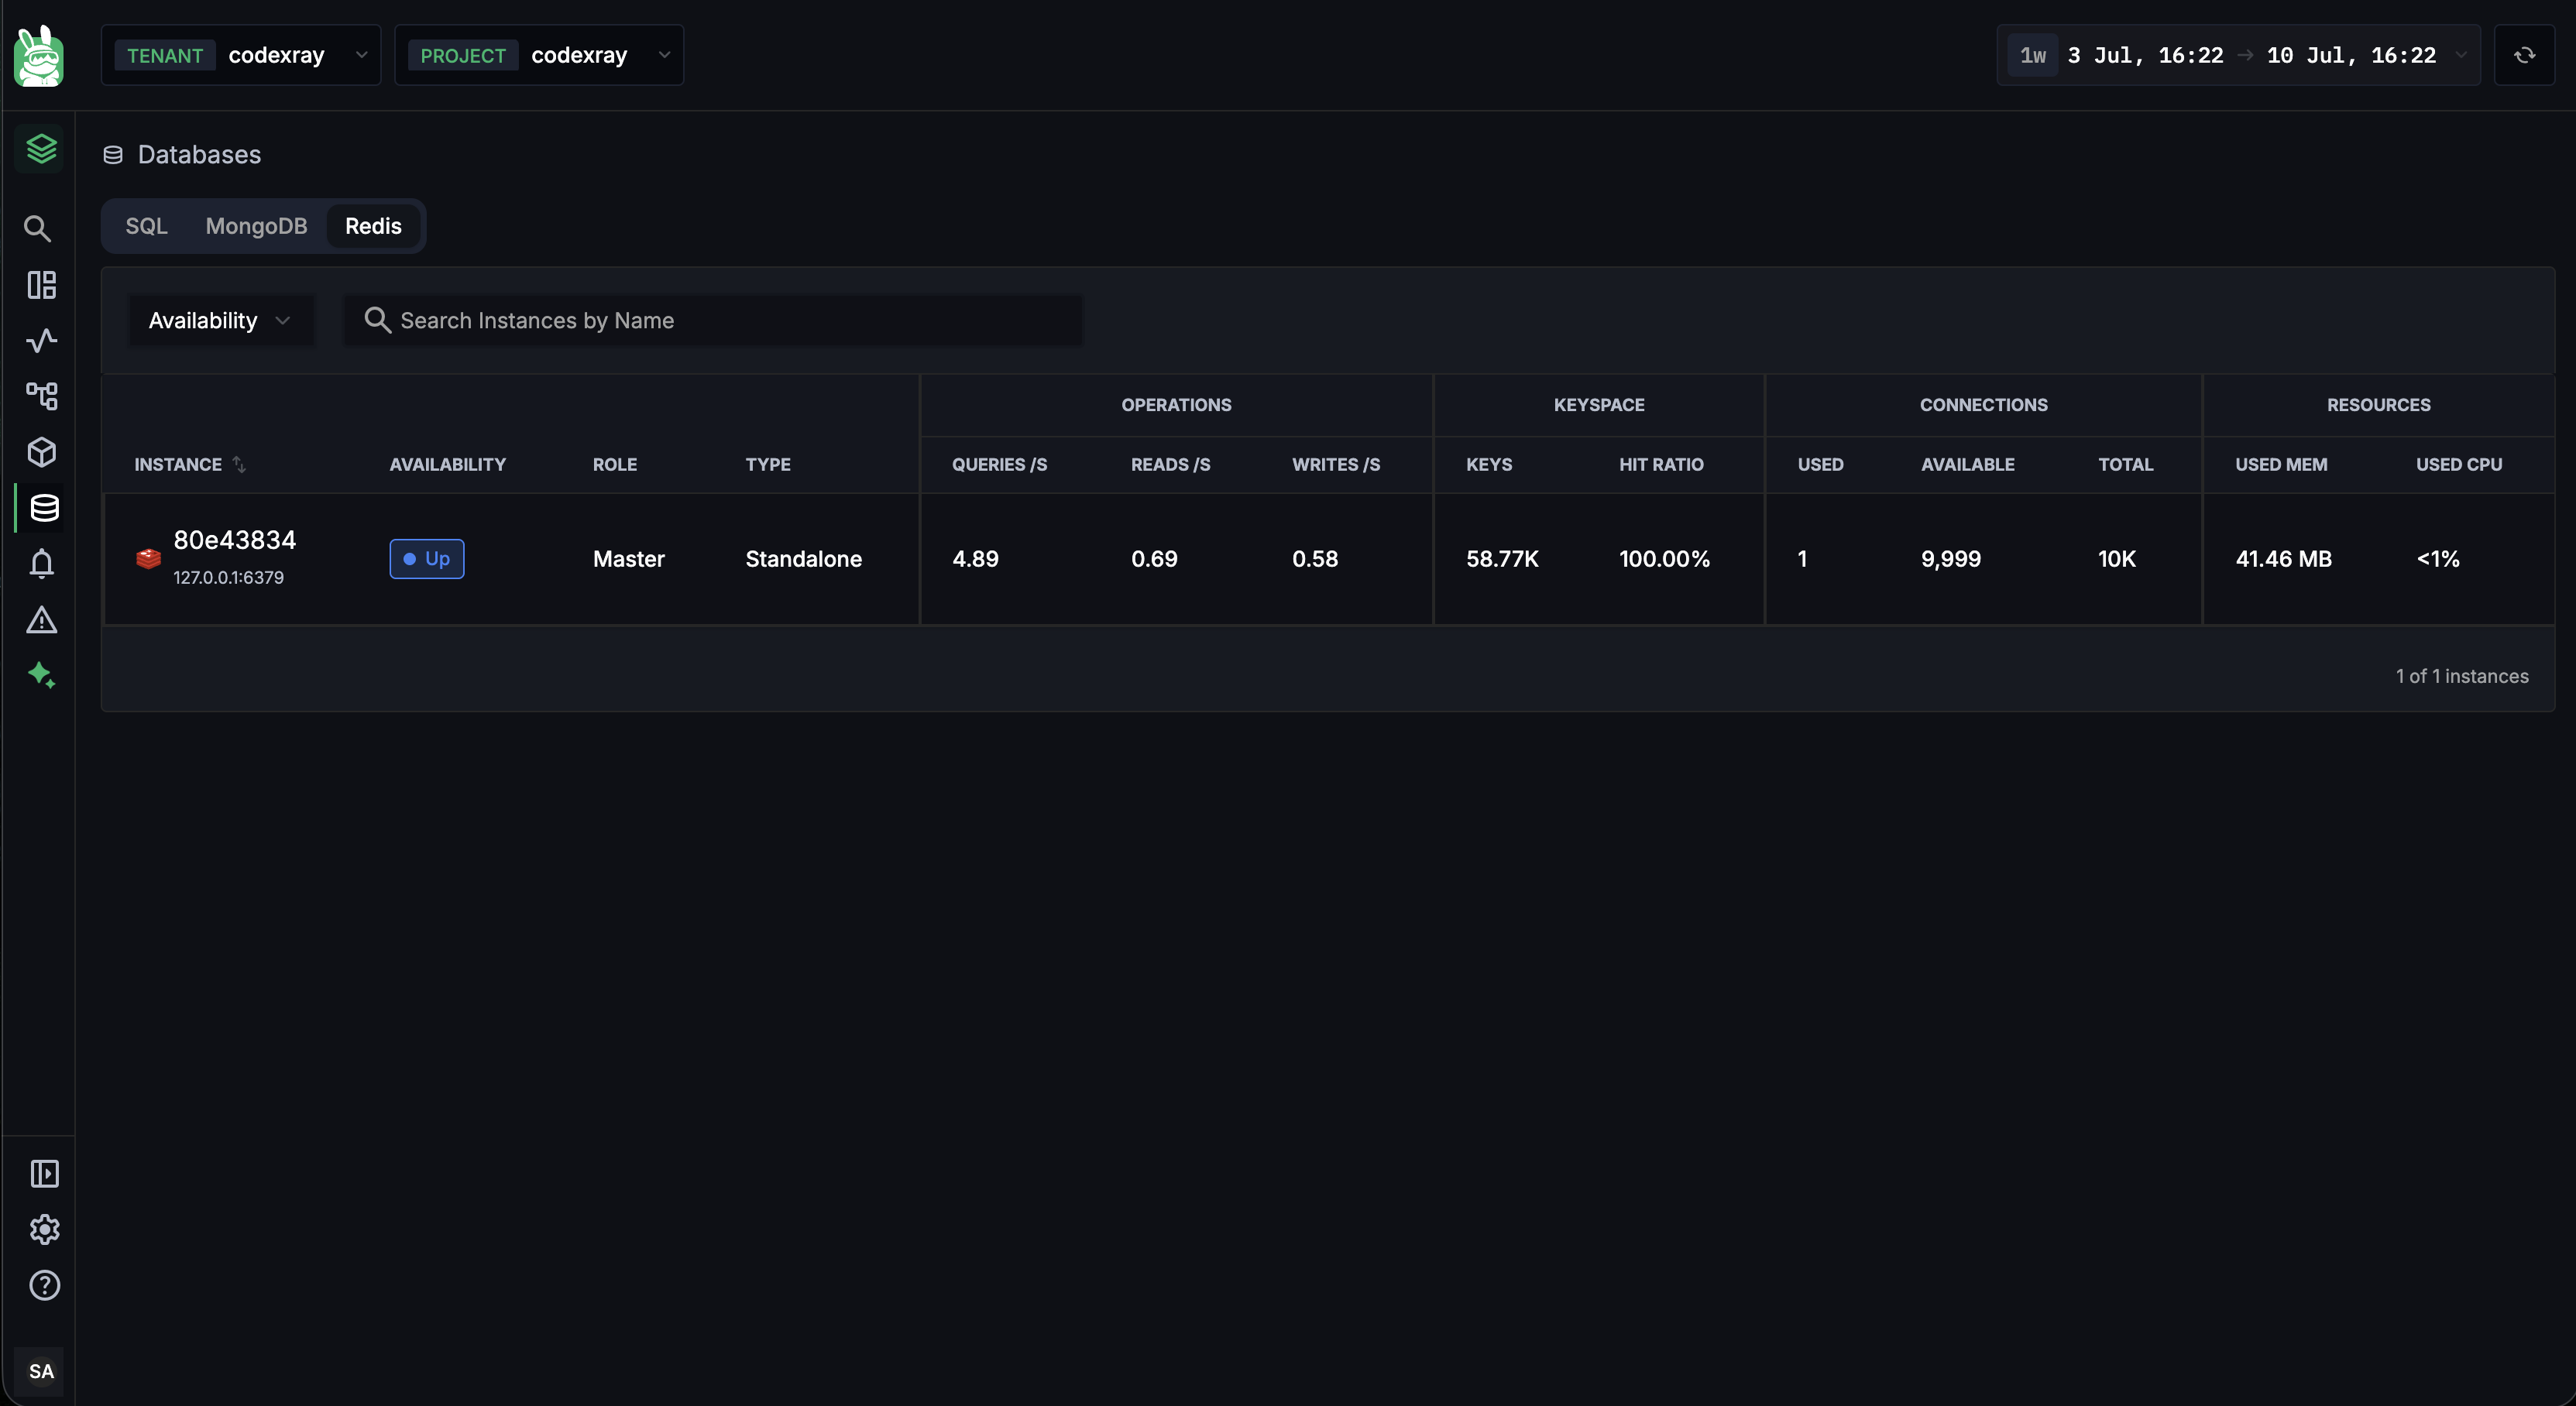
The Redis instance list
The Redis tab lists every monitored instance with key-value-native signals:
| Column | What it shows |
|---|---|
| INSTANCE | Instance name, with a Redis icon and ip:port · N nodes subtext |
| AVAILABILITY | Up / Down live status |
| ROLE | master / replica |
| TYPE | Standalone / Cluster / Sentinel |
| OPERATIONS — QUERIES /s | Commands per second |
| OPERATIONS — READS /s | Read commands per second |
| OPERATIONS — WRITES /s | Write commands per second |
| KEYSPACE — KEYS | Total keys held |
| KEYSPACE — HIT RATIO | Share of key lookups served from memory |
| CONNECTIONS — USED / AVAILABLE / TOTAL | Client connection state |
| RESOURCES — USED MEM / USED CPU | Memory and CPU utilisation |
Use the Search Instances by Name box to find an instance, then click a row to open it.
For a cache, HIT RATIO is the single most important number on this list. A ratio that drops means more requests are missing the cache and falling through to your primary datastore — often the first visible sign of an eviction or memory-pressure problem.
Instance detail
Opening an instance shows a breadcrumb of Databases › Redis › instance with quick badges for role, type, and version (e.g. master · standalone · v7.2.4), and four tabs:
Overview
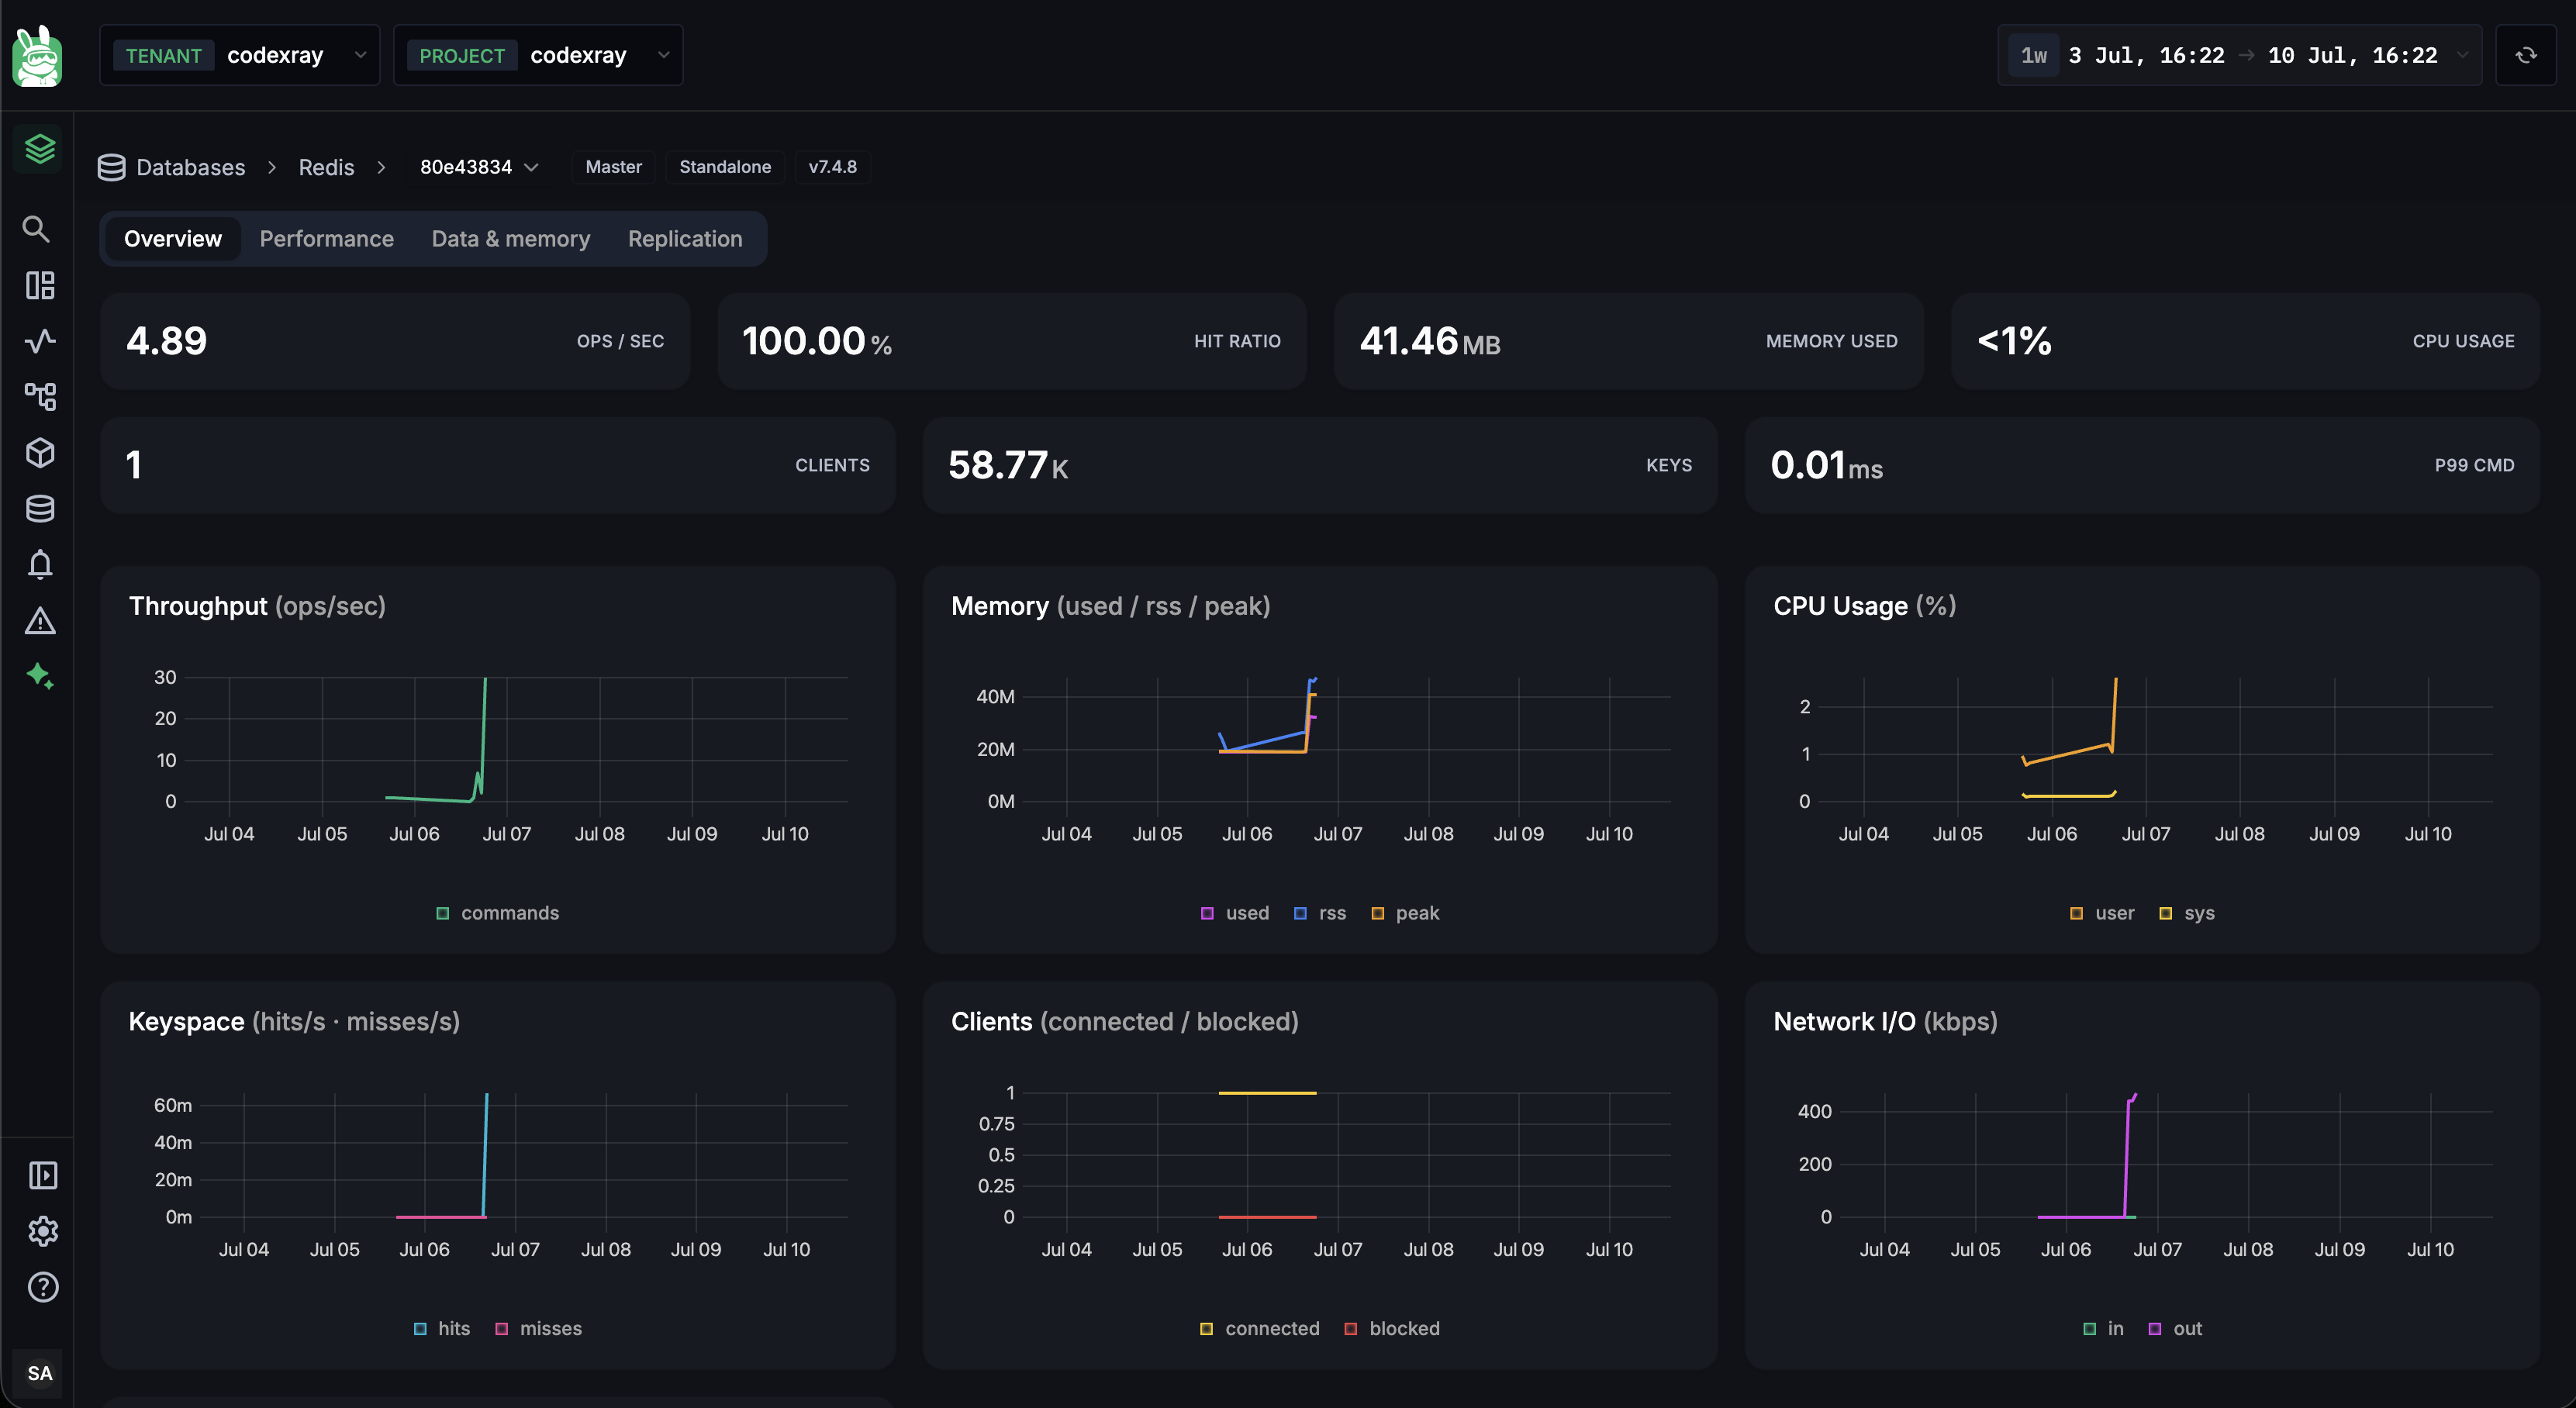
The Overview tab is the instance's health at a glance. Seven KPI cards sit across the top:
| Card | What it tells you |
|---|---|
| Ops / sec | Total commands per second |
| Hit Ratio | Share of lookups served from memory |
| Memory Used | Current memory footprint |
| CPU Usage | CPU utilisation |
| Clients | Connected clients |
| Keys | Total keys held |
| P99 Cmd | 99th-percentile command latency |
Below the cards, a set of live stat charts tracks the instance's behaviour over the window — the fastest way to see how a number got to where it is, not just its current value:
| Chart | What it plots |
|---|---|
| Throughput (ops/sec) | Commands processed over time |
| Memory (used / rss / peak) | Logical usage, OS-resident memory, and the high-water mark together |
| CPU Usage (%) | Split into user and sys |
| Keyspace (hits/s · misses/s) | Cache hits against misses — the shape of your hit ratio |
| Clients (connected / blocked) | Client count and how many are blocked waiting |
| Network I/O (kbps) | Bytes in and out |
The cards tell you what the instance looks like right now; these charts tell you how it got there. A hit ratio that reads 100% but whose Keyspace chart shows a rising misses line is trending the wrong way — you'd never see that from the card alone.
Performance
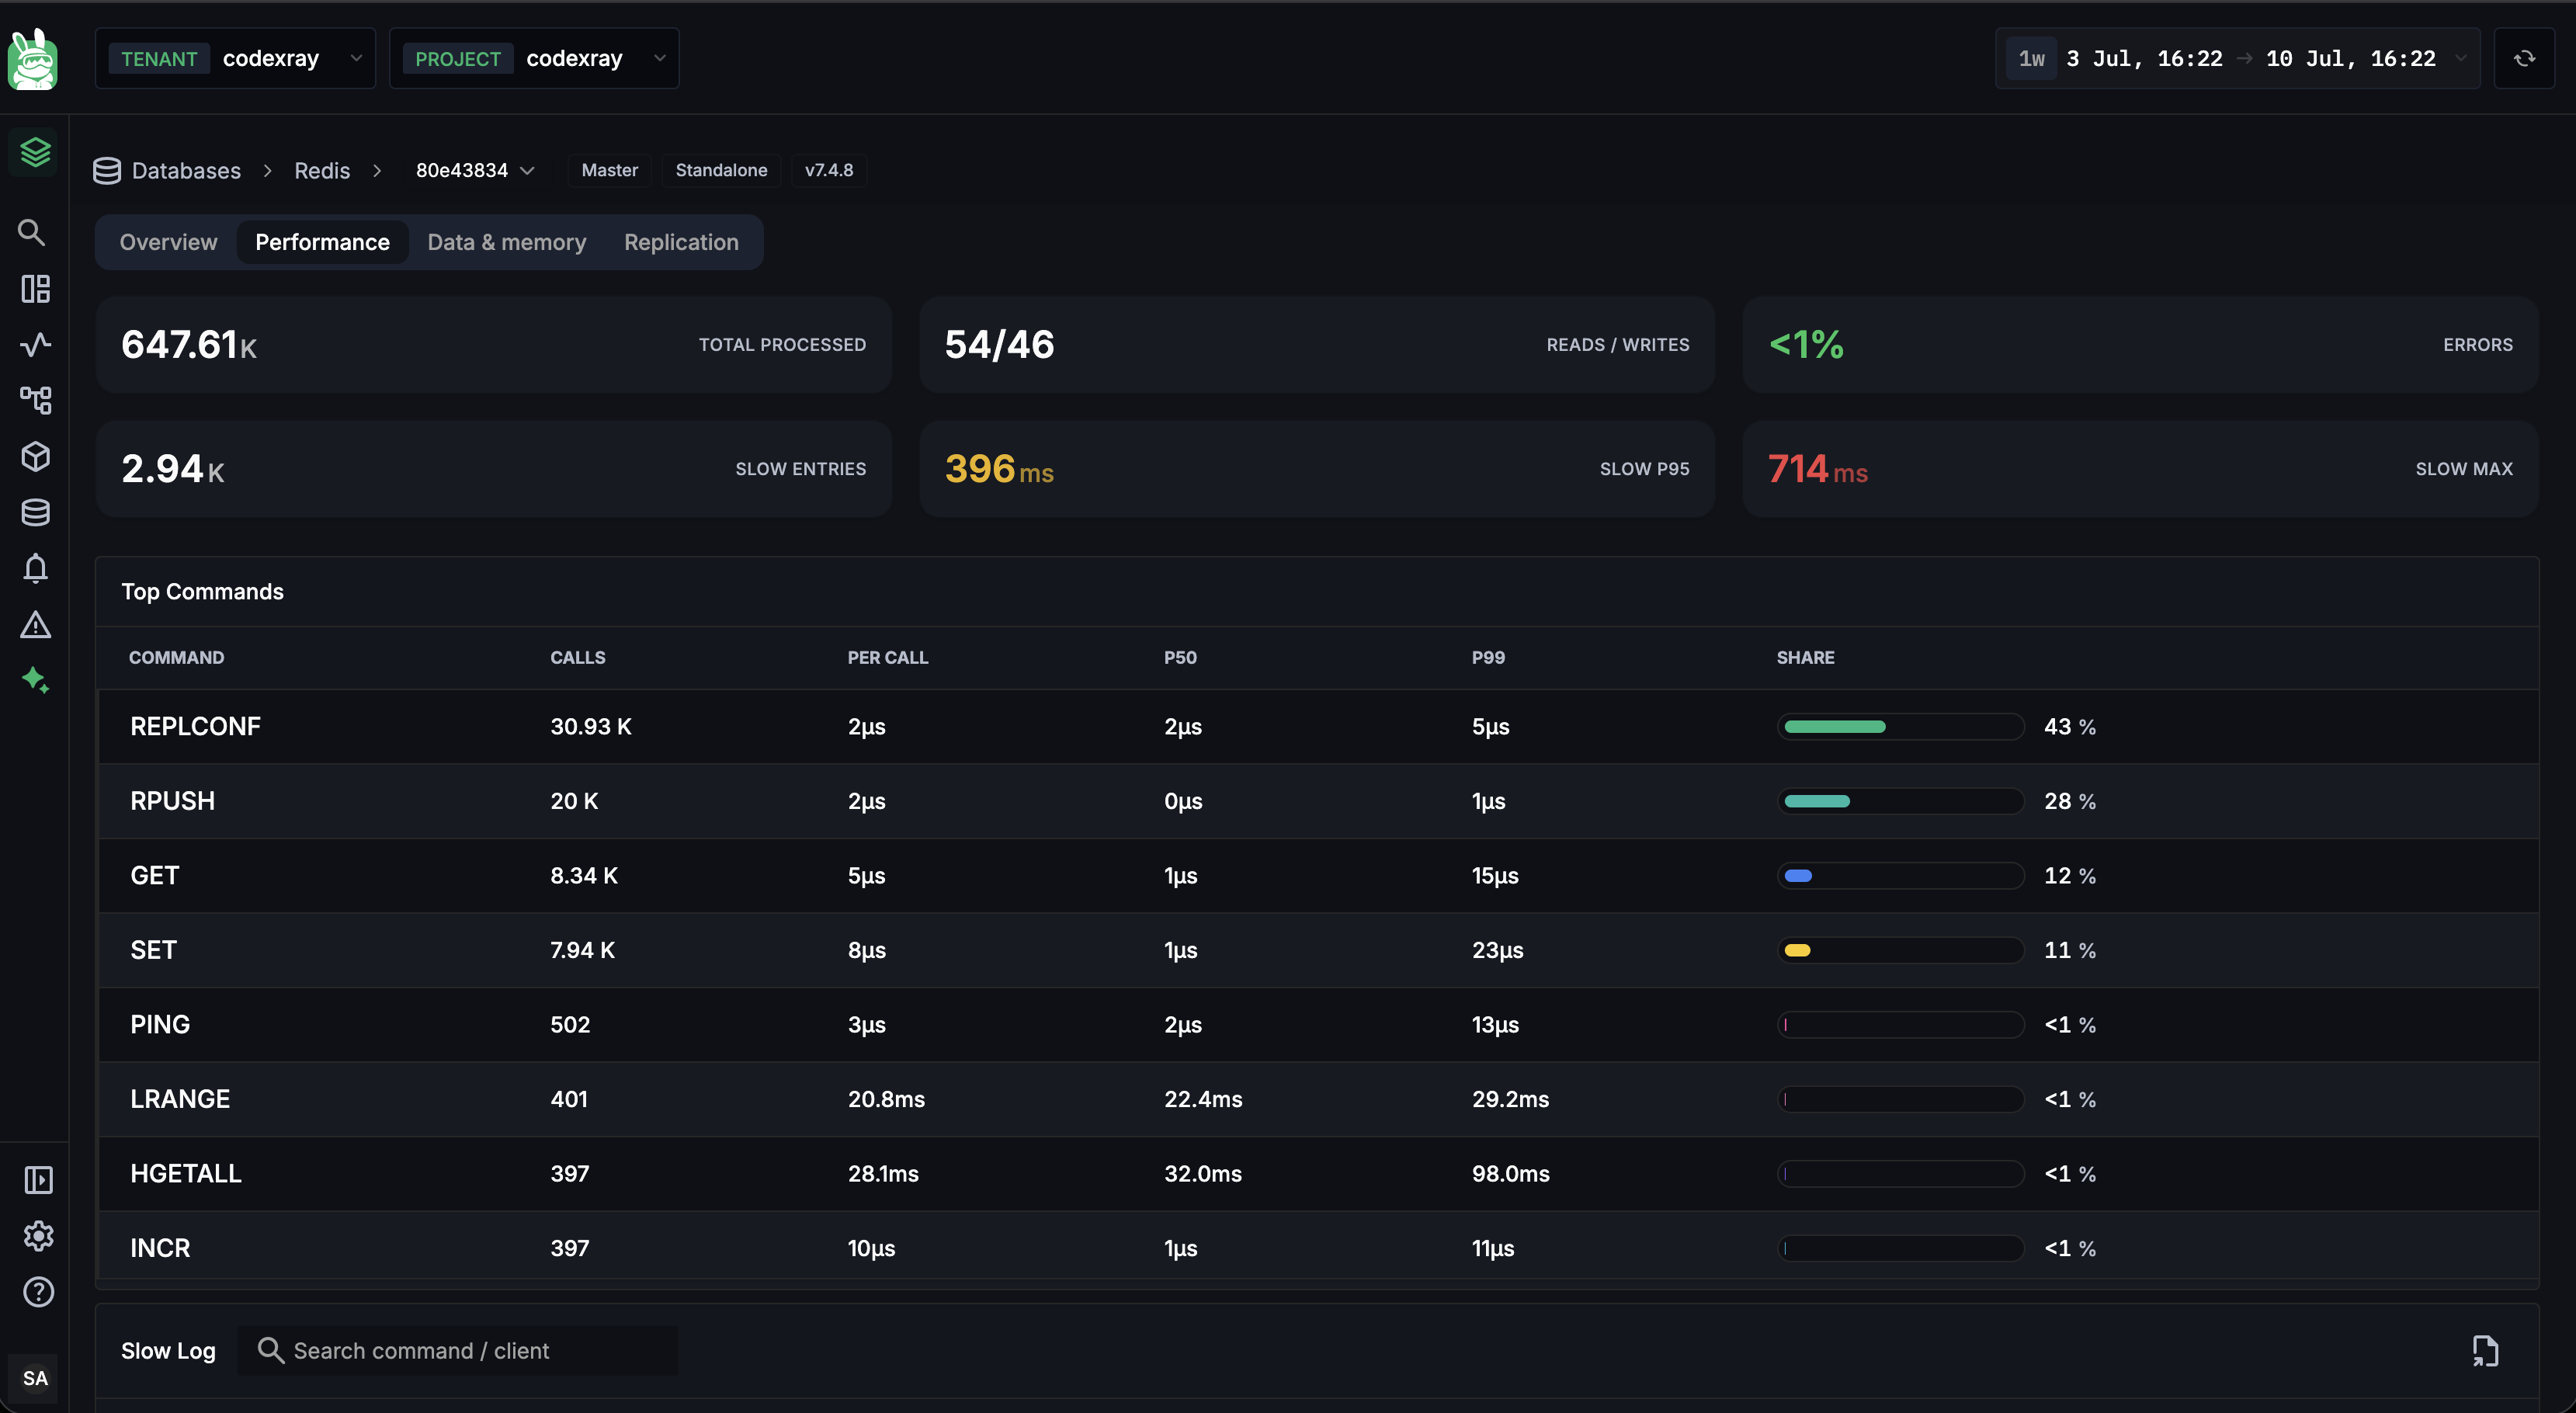
The Performance tab is where you find which commands cost you. KPI cards summarise throughput and slow-command pressure — Total Processed, Reads / Writes, Errors, Slow entries, Slow p95, and Slow max — over two detailed tables.
Top Commands — every command type, ranked:
| Column | What it shows |
|---|---|
| COMMAND | The Redis command (GET, HSET, EXPIRE, …) |
| CALLS | How many times it was called in the window |
| PER CALL | Mean time per call |
| P50 | Median command latency |
| P99 | 99th-percentile command latency |
| SHARE | This command's share of total command time |
Slow Log — individual slow commands captured by Redis:
| Column | What it shows |
|---|---|
| ID | Slow-log entry ID |
| COMMAND | The exact command that ran slowly |
| DURATION | How long it took — sortable, and colour-coded by severity so the worst offenders stand out at a glance |
| CLIENT ADDR | The client that issued it |
| WHEN | When it happened |
Sort by DURATION to bring the slowest commands to the top — the colour coding (faster → slower) makes the outliers obvious without reading the numbers. Use the Search command / client box to filter to a specific command or client, and export the slow log to CSV to share or attach to an incident.
A command with a high P99 but low SHARE hurts a few requests badly; one with a moderate P99 but high SHARE is quietly dominating your Redis time budget. Optimise the high-SHARE commands first for the biggest overall win.
Data & Memory
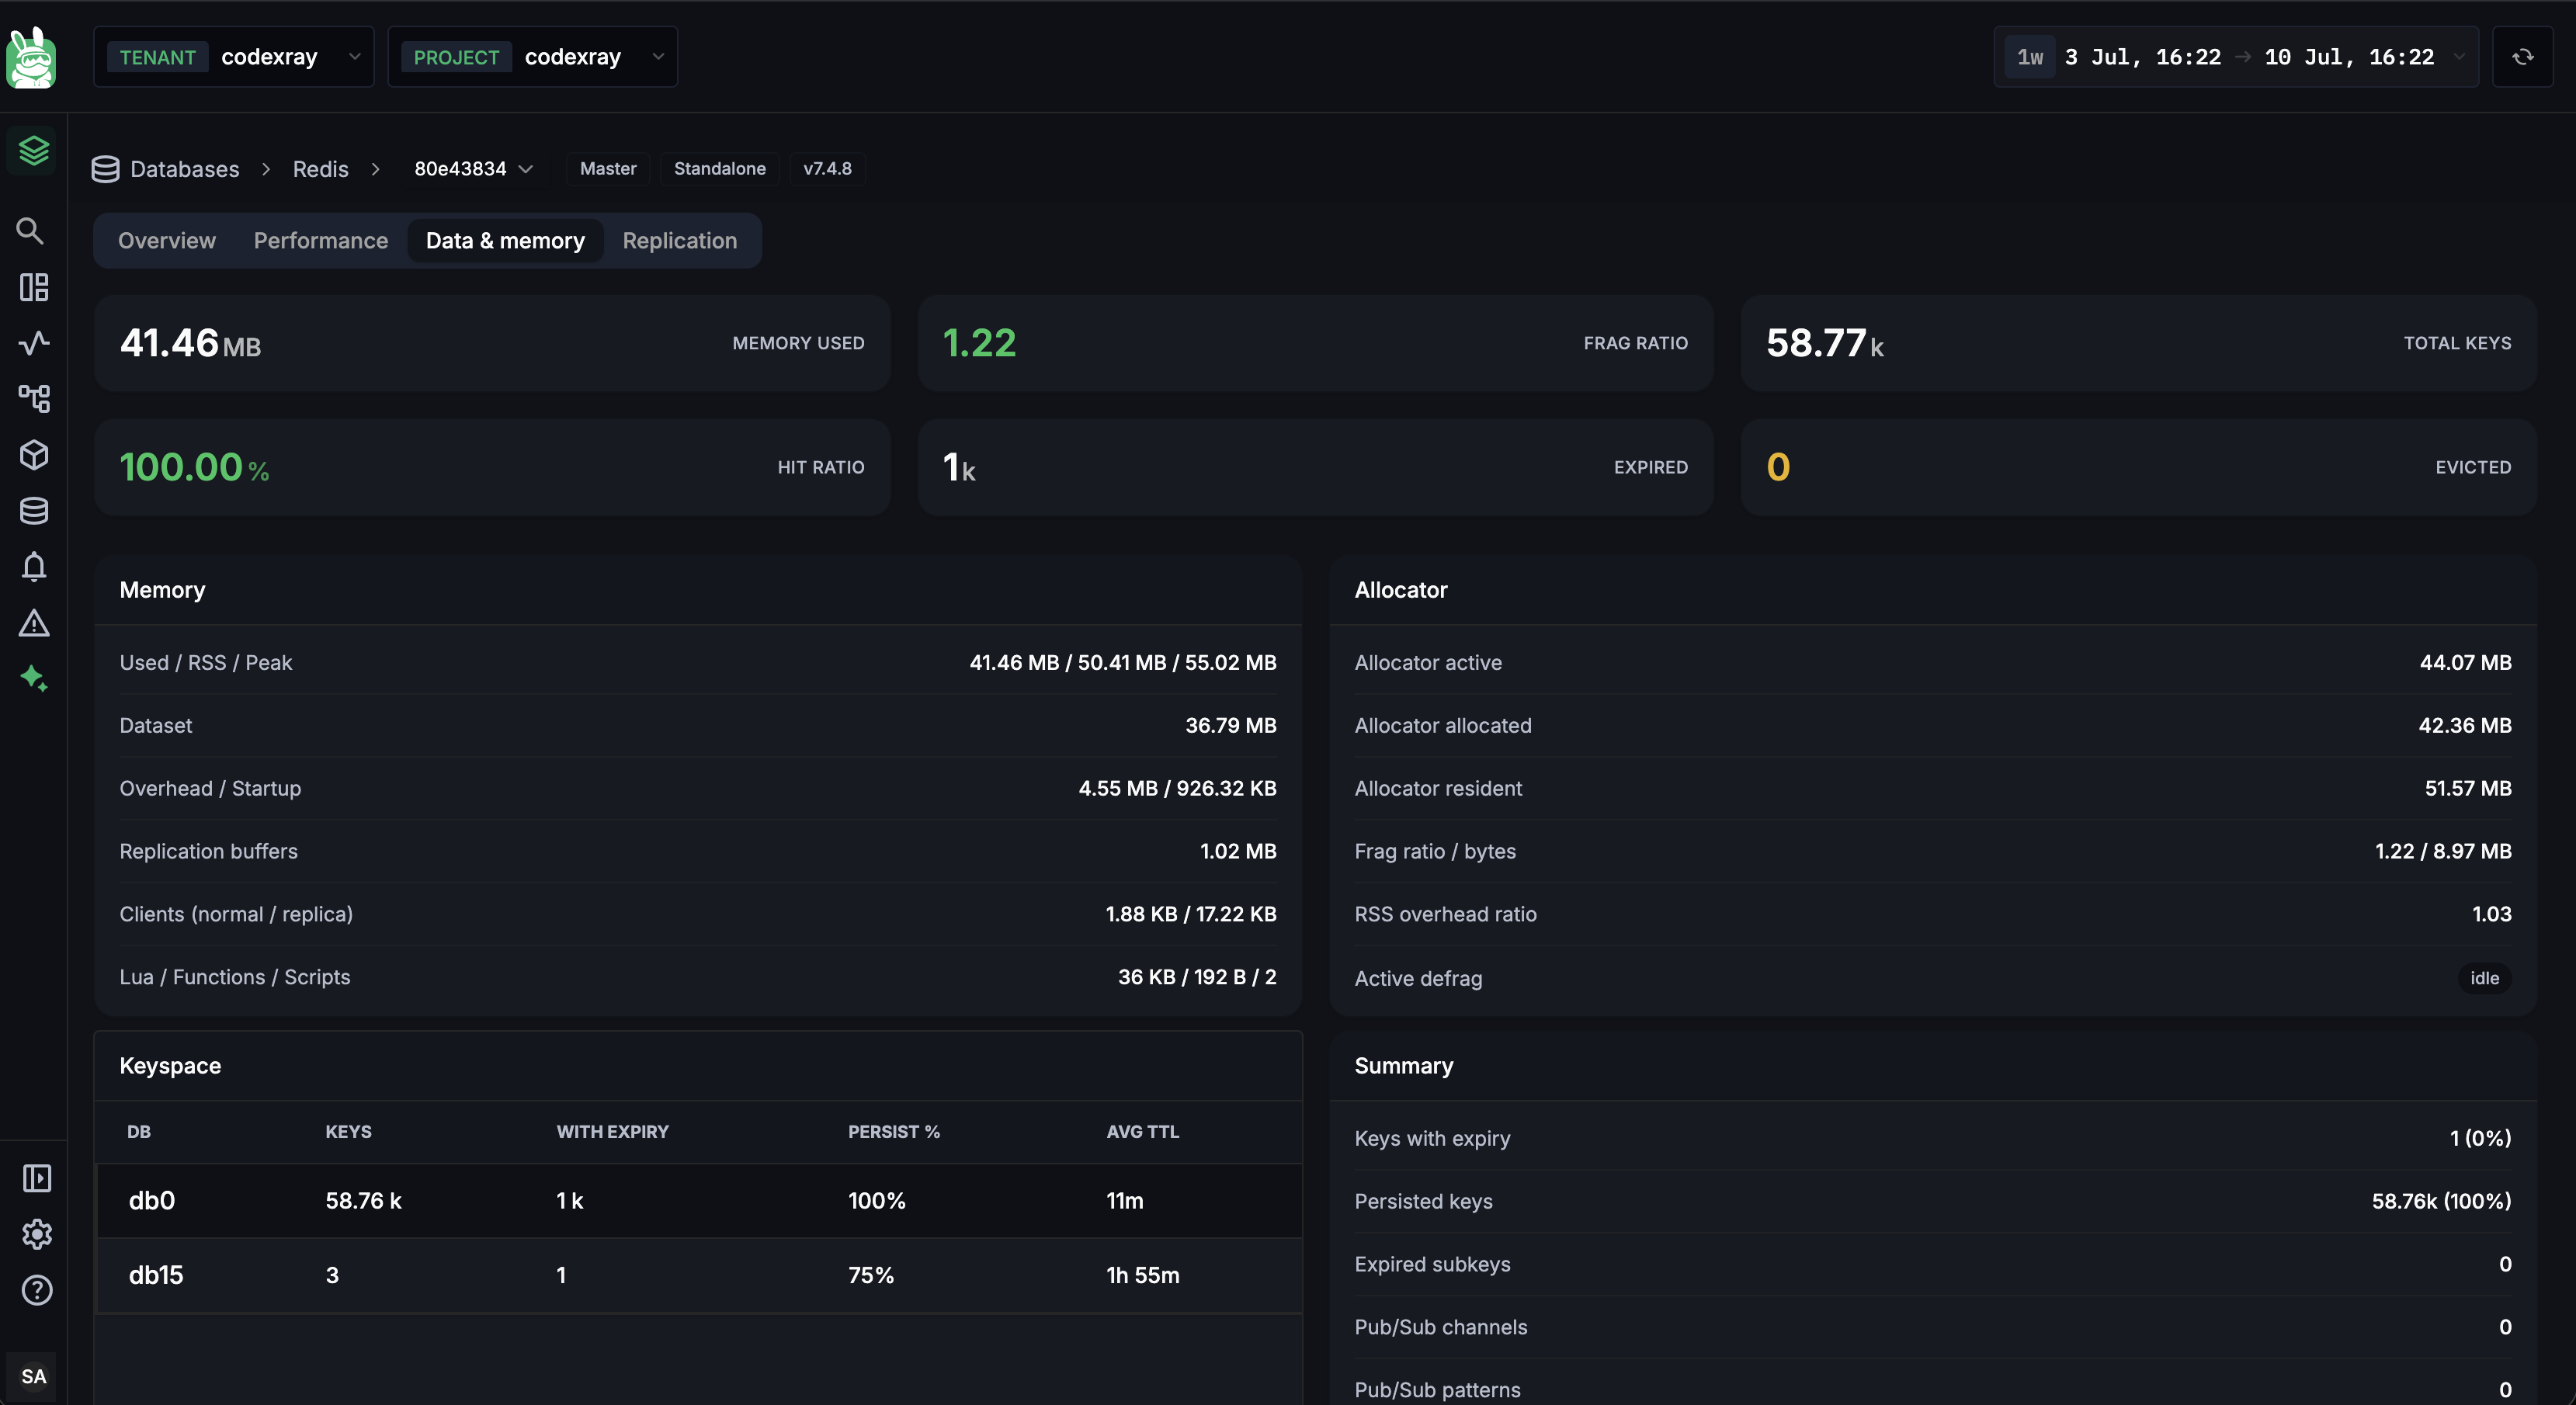
The Data & Memory tab explains where memory is going and how the keyspace is structured — the two things that decide whether Redis stays fast or starts evicting. Six cards head the tab: Memory Used, Frag Ratio, Total Keys, Hit Ratio, Expired, and Evicted.
Memory panel — a breakdown of what's consuming memory:
- Used / RSS / Peak — logical usage, OS-resident memory, and the high-water mark
- Dataset — memory holding your actual data
- Overhead / Startup — Redis's own bookkeeping
- Replication buffers — memory backing replication
- Clients (normal / replica) — memory held by client buffers
- Lua / Functions / Scripts — memory used by server-side scripting
Allocator panel — the memory allocator's own view:
- Allocator active / allocated / resident
- Frag ratio / bytes — fragmentation, the classic cause of "used memory looks fine but RSS is huge"
- RSS overhead ratio
- Active defrag — whether online defragmentation is
activeoridle
Keyspace table — per logical database:
| Column | What it shows |
|---|---|
| DB | Logical database number |
| KEYS | Keys in that database |
| WITH EXPIRY | Keys that carry a TTL |
| PERSIST % | Share of keys with no expiry |
| AVG TTL | Average time-to-live |
A Summary panel rounds it out with keys-with-expiry, persisted keys, expired subkeys, and Pub/Sub channel / pattern / client counts.
If Frag Ratio is well above 1.0 while Memory Used looks reasonable, the OS is holding far more memory than your data needs. That's fragmentation — and it's exactly what Active defrag exists to reclaim.
Replication
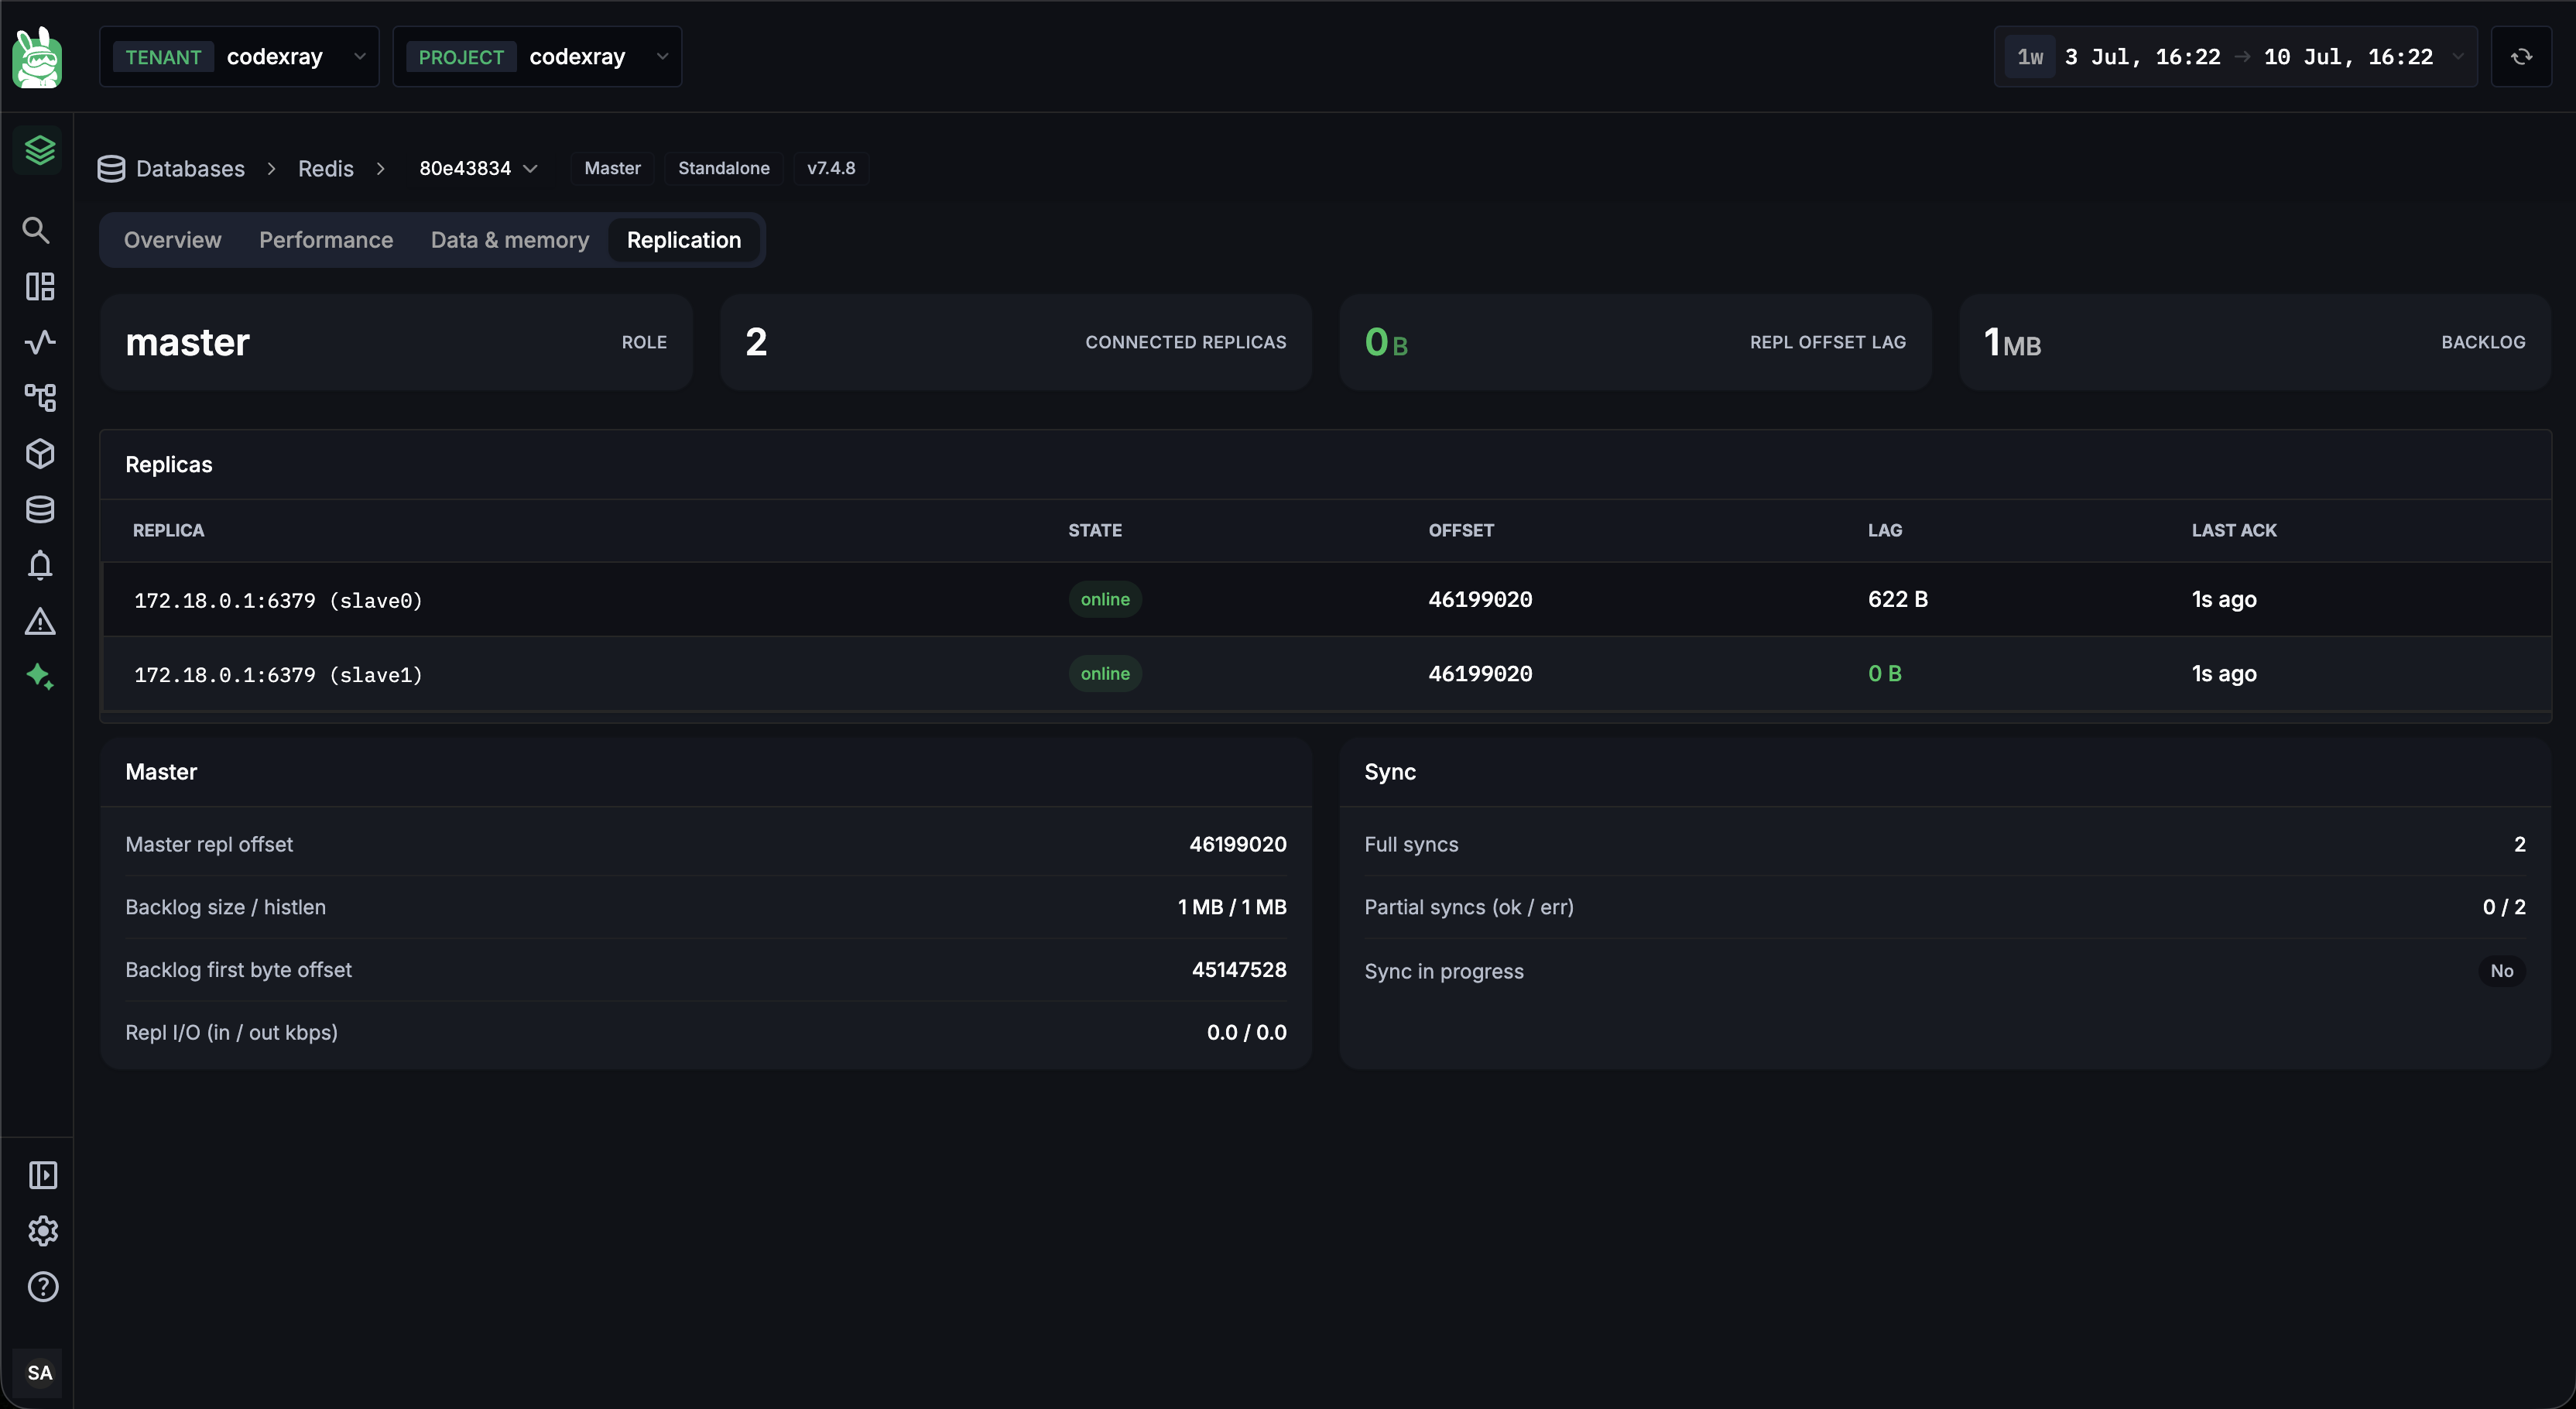
The Replication tab answers "are my replicas keeping up?" Four cards head it — Role, Connected Replicas, Repl Offset Lag, and Backlog.
Replicas table — one row per connected replica:
| Column | What it shows |
|---|---|
| REPLICA | Replica address |
| STATE | Replication state |
| OFFSET | Replica's replication offset |
| LAG | How far behind the master it is |
| LAST ACK | Time since the replica last acknowledged |
Two supporting panels add the master's perspective:
- Master — master replication offset, backlog size / histlen, backlog first-byte offset, and replication I/O (in / out).
- Sync — full syncs, partial syncs (ok / err), master link state, and whether a sync is in progress.
The Replicas table and the Master / Sync panels — including the master link state — are only shown when the instance actually has replicas attached. A standalone instance with none shows a clear "No replicas connected" state instead of empty tables, so an unattached instance never looks like a broken one.
A healthy replication setup resyncs partially — cheaply catching up from the backlog. A rising full syncs count means replicas are falling out of the backlog window and doing expensive full resyncs, which is worth investigating (often a backlog sized too small for the write rate).
Common workflows
"Redis latency spiked"
- Open the instance → Performance.
- Scan Top Commands by P99 and SHARE — a single command usually stands out.
- Check the Slow Log for individual slow commands and the CLIENT ADDR issuing them.
"We're seeing evictions / cache misses"
- Open Data & Memory and compare Memory Used against the instance's max memory.
- Check Evicted and Expired, and the Keyspace table's PERSIST % — a large persistent keyspace with no TTLs is a common cause of memory pressure.
- If Frag Ratio is high, fragmentation (not data) is consuming RSS — see the Allocator panel.
"A replica looks behind"
- Open Replication and check the replica's LAG and LAST ACK.
- Compare the master OFFSET with each replica's OFFSET in the table.
- A climbing full syncs count in the Sync panel points at a backlog too small for the write rate.
Next steps
- SQL Databases — PostgreSQL, MySQL, and MSSQL monitoring
- MongoDB Monitoring — the document-database companion view
- Database Insights — the application-scoped view of the same databases
- CodeXray Database Agent — install and configure the agent that drives these views