Advanced Database Monitoring
Advanced Database Monitoring is CodeXray's engine-level view of your databases. Where Database Insights shows how a service uses its databases (from the application's perspective), Advanced Database Monitoring shows how the database engine itself is running — connections, waits, memory, replication, slow queries, and everything an operator needs to answer "what is the database doing right now?"
- Database Insights — the consumer view: "which of my service's queries are slow?"
- Advanced Database Monitoring — the engine view: "what is the database doing right now?"
Most DBAs and SREs use them together — one to find the slow query, the other to understand why the engine responded slowly.
One module, purpose-built per engine
Not every database answers the same questions. A relational engine cares about wait events and query plans; Redis cares about keyspace, memory fragmentation, and replication backlog; MongoDB cares about collections, replica-set nodes, and document scans. So the Databases module gives each engine family a view built around its way of thinking — while keeping the fleet list, navigation, and workflow consistent.
The module is organised into three families, each with its own dedicated guide:
| Family | Engines | What its views are built around | Guide |
|---|---|---|---|
| SQL | PostgreSQL · MySQL · MSSQL | Top queries, active connections by wait group, engine vital signs, and (PostgreSQL) query-plan inspection | SQL Databases |
| MongoDB | MongoDB | Replica-set nodes, slow operations with plan summaries, collections & schema, cluster composition | MongoDB Monitoring |
| Redis | Redis | Keyspace & hit ratio, per-command latency, memory & allocator, replication | Redis Monitoring |
Where to find it
Click Databases in the main left sidebar. This opens the fleet-wide view of every database CodeXray is monitoring, with a SQL / MongoDB / Redis switcher at the top.
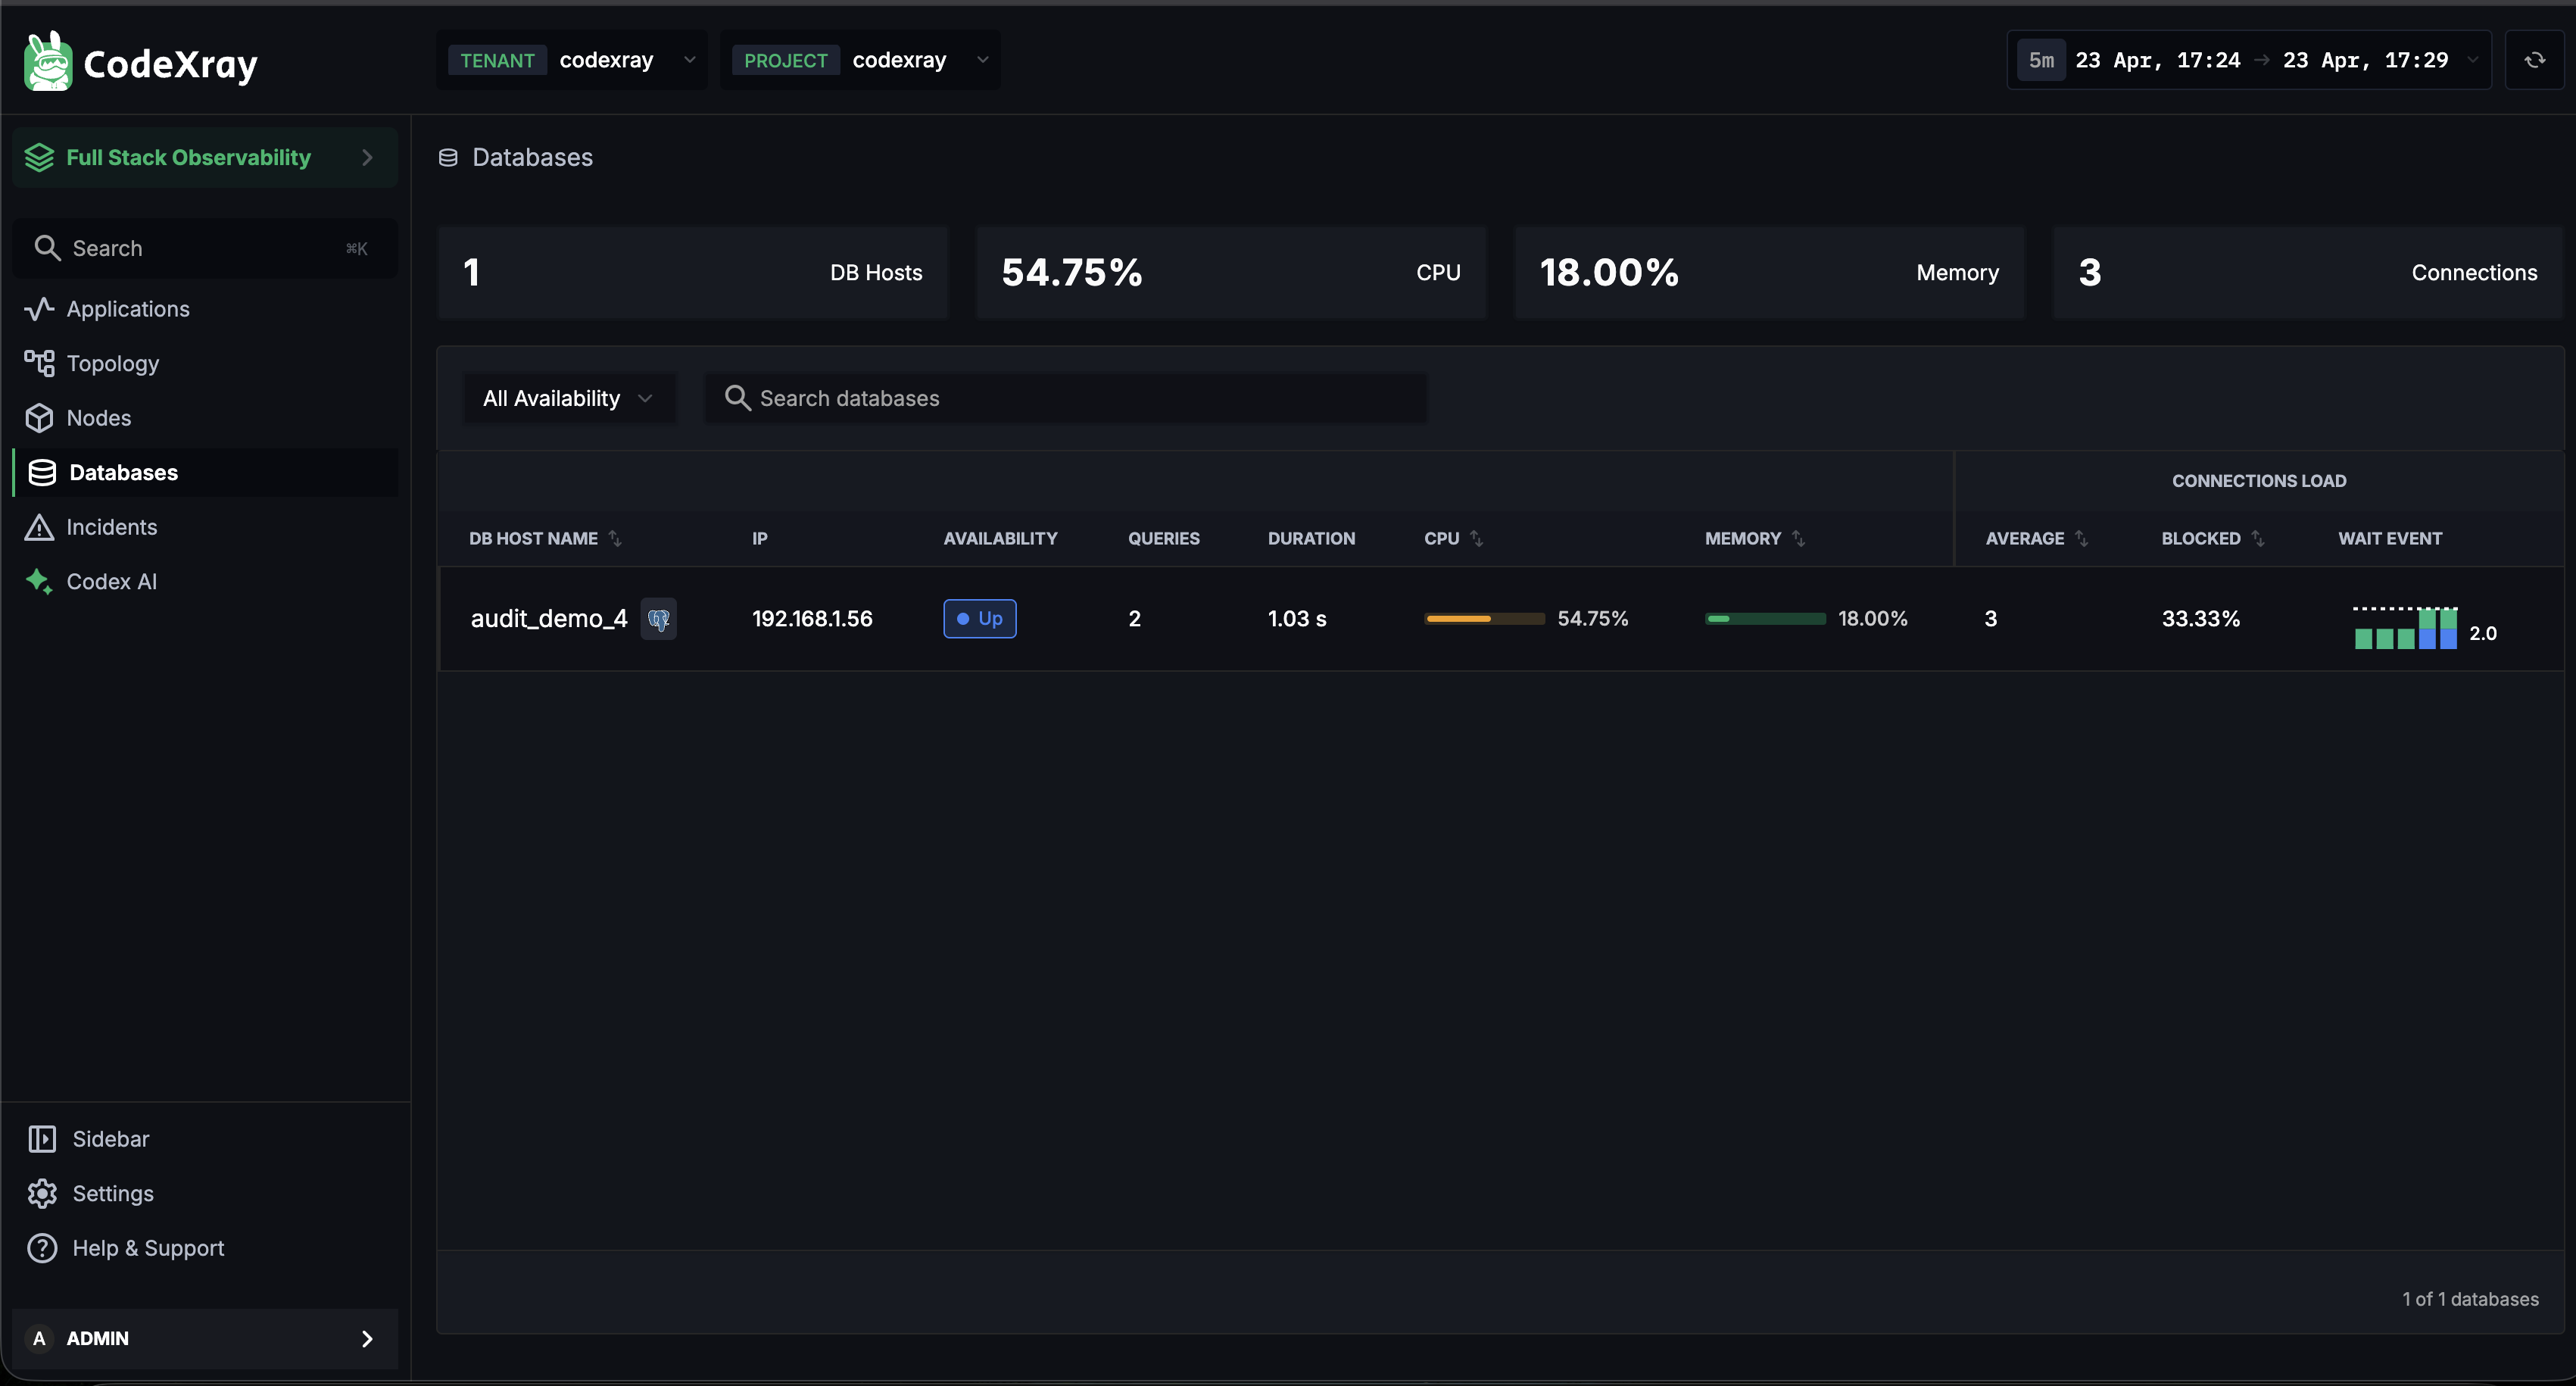
Each tab lists the databases of that family with live health signals tailored to the engine. Pick the tab for the engine you want, then click any row to open its detail view.
The fleet list isn't one generic table. The SQL tab leads with query rate, duration, CPU/memory and connection pressure; the MongoDB tab leads with cluster type, node count, and read/write operations; the Redis tab leads with role, keyspace size, and hit ratio. You always see the signals that matter for that engine first.
Choosing where to look
Different symptoms start in different places. This map gets you to the right view fast:
How the data gets there
Every view in this module is powered by the CodeXray Database Agent, which connects to each database with a read-only monitoring user, reads the engine's own statistics on a short polling cycle, and ships them to CodeXray. It never sits in the query path and adds no latency to your workload.
Once the agent is running, each database appears in its family tab within a polling cycle — no extra configuration on CodeXray's side.
Getting started
- Deploy the CodeXray Database Agent and point it at your PostgreSQL, MySQL, MSSQL, MongoDB, or Redis instances. Per-engine permissions and a minimal config sample are on the agent page.
- Open Databases in the sidebar and choose the SQL, MongoDB, or Redis tab.
- Click into any database and follow the dedicated guide for its engine:
- SQL Databases — PostgreSQL, MySQL, MSSQL
- MongoDB Monitoring
- Redis Monitoring
Next steps
- SQL Databases — Top Queries, Metrics, Active Connections, and PostgreSQL query plans
- MongoDB Monitoring — replica-set nodes, slow operations, collections & schema
- Redis Monitoring — keyspace, per-command latency, memory, and replication
- Database Insights — the application-scoped companion view
- CodeXray Database Agent — install and configure the agent that drives these views