Application Categories
Microservice fleets get noisy fast. Fifty services in the Applications list, a topology that spans the whole screen, dashboards that lump everything together — and the team has to mentally filter every view to find the slice that matters to them.
Application Categories fix that. Group your services into meaningful buckets — by team, product, layer, or any axis you like — and every CodeXray view picks up the grouping automatically.
- Custom Applications decide what an application is — they let you override CodeXray's default grouping for non-Kubernetes workloads.
- Application Categories organise applications you already have into higher-level groups — for navigation, dashboards, and filtering.
Where to Find It
Application Categories are managed under Settings → Categories in the main sidebar.
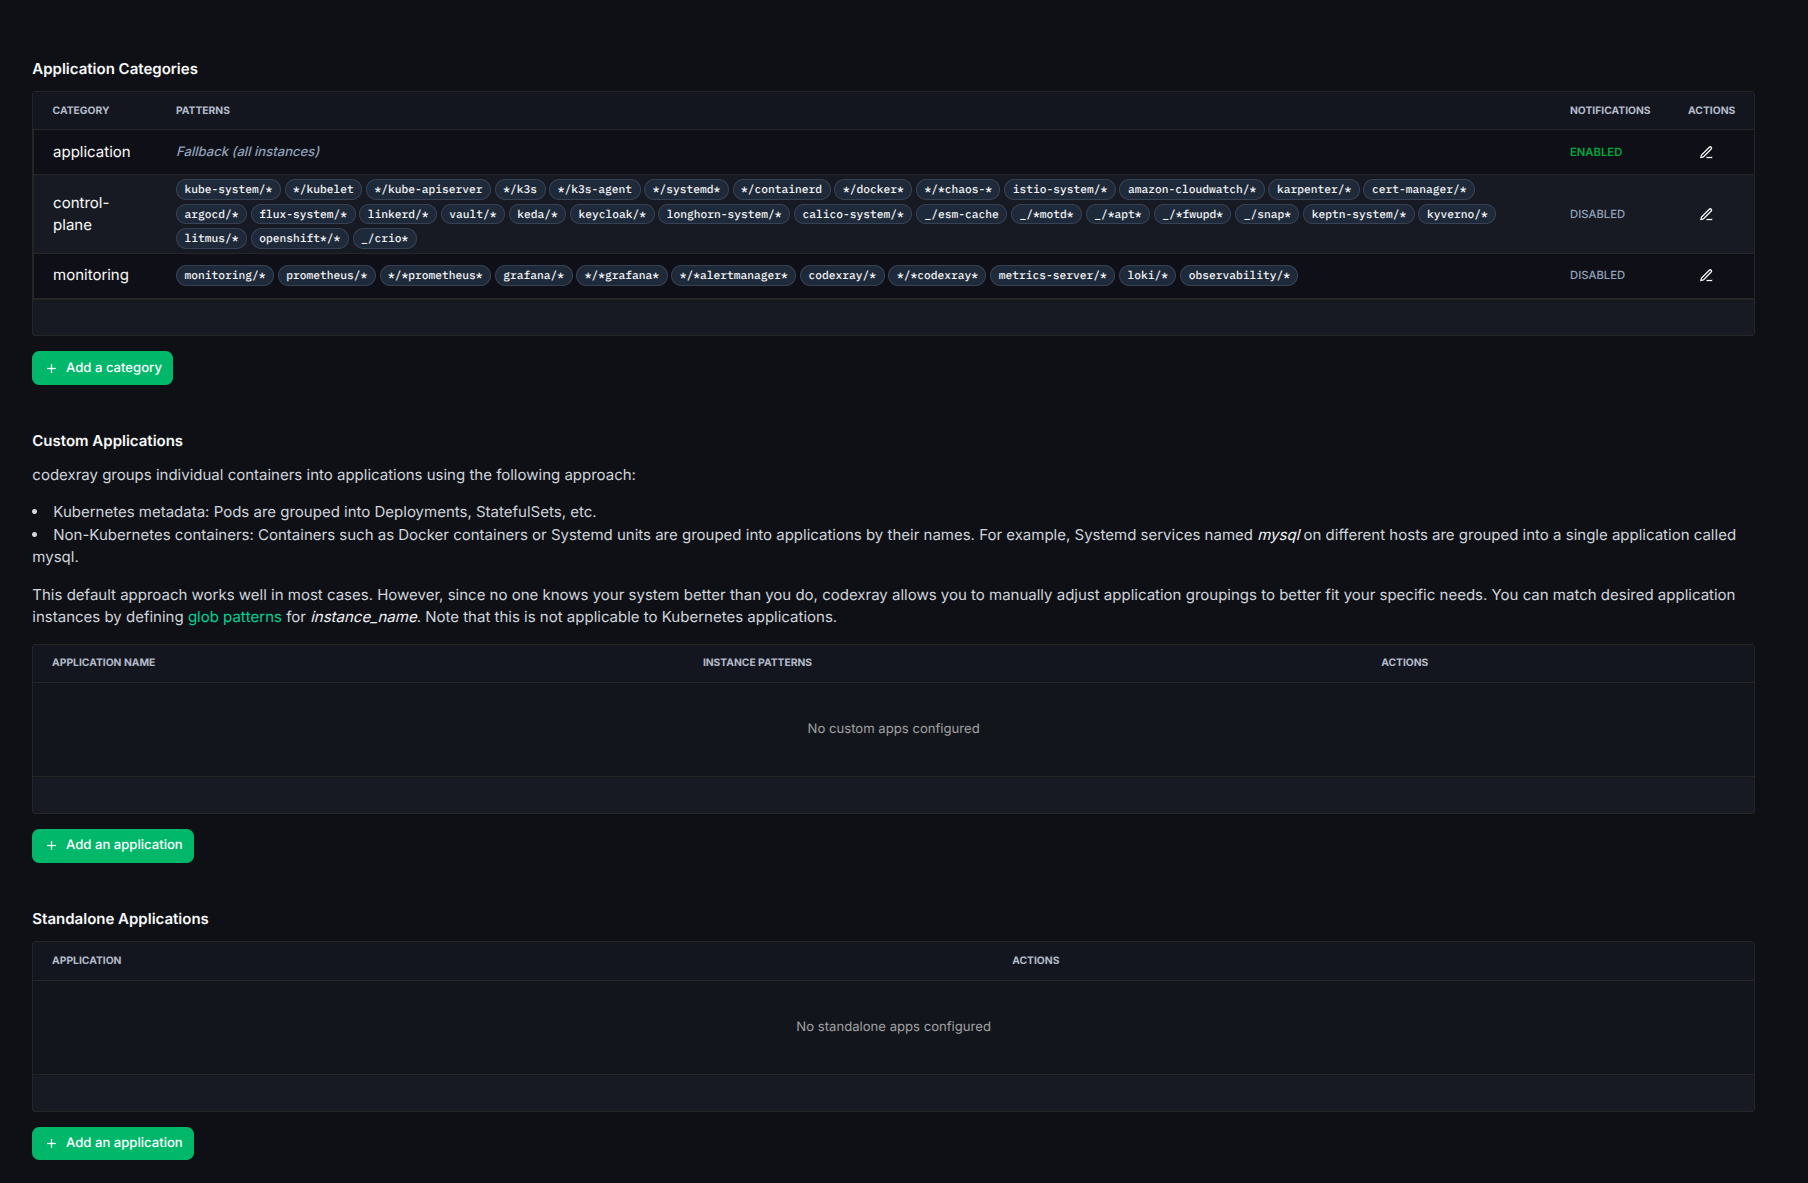
The page lists every category in the current project, with the services assigned to each one. From here you can create new categories, rename them, and add or remove services.
What a Category Looks Like
Each category has:
- A name — short, lowercase, descriptive (e.g.,
checkout,platform,frontend,databases) - A member list — the applications assigned to this category
- An auto-computed status —
OK/WARNING/CRITICAL, rolled up from the health of every service inside
Categories are project-scoped — define them once per project and they apply across every view in that project.
Common Ways to Categorise
There's no single right way. Pick the axis that matches how your team works:
| Axis | Example categories |
|---|---|
| By product / feature | checkout, search, recommendations, accounts |
| By team ownership | payments-team, platform-team, growth-team |
| By architectural layer | frontend, api-gateway, business-logic, databases, external |
| By criticality | tier-1-critical, tier-2-important, tier-3-background |
| By environment | (rare — usually you'd use separate projects for environments) |
Mix and match if it helps — a service can belong to multiple categories.
Creating a Category
Click + Add Category from the configuration page. Set a name and pick the applications that belong in it. Save, and the new category is live across the project immediately.
Categories take effect across:
- Applications list — services group by category
- Topology — nodes colour-code by category
- Dashboards — a dedicated category view per category
- Alerts — alert rules can scope by category
- Custom Risk Scoring (API Security) — category-level risk rollups
Category Dashboards
Open any category to see its dedicated dashboard — a focused view of just the services in that group.
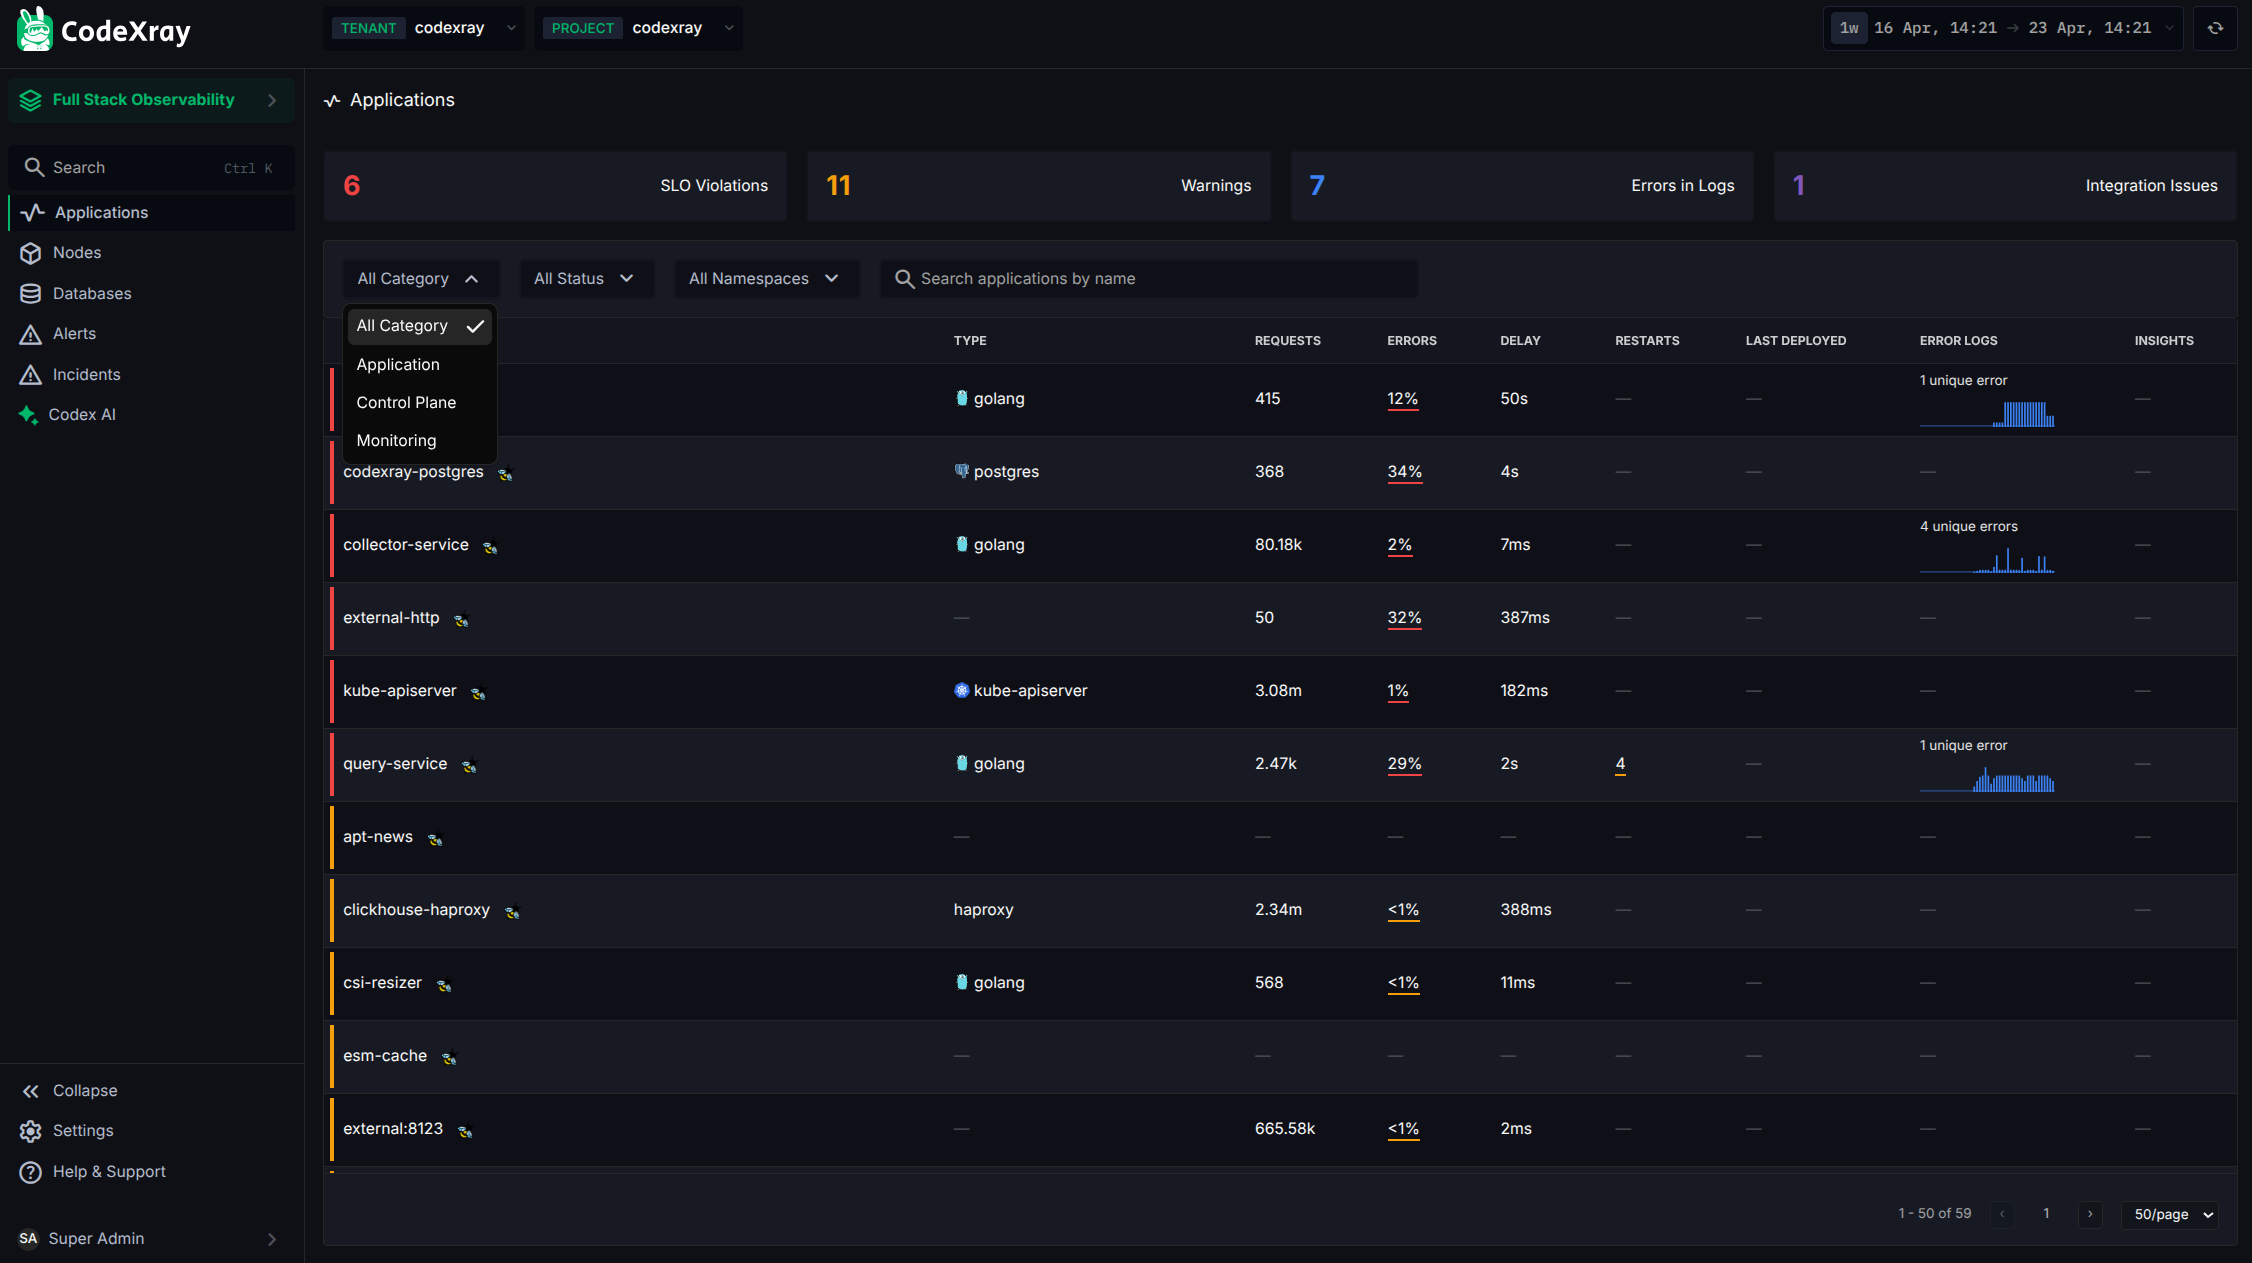
The dashboard shows:
- The services in this category with their current health badges
- Aggregate RED metrics — combined request rate, error rate, and latency across the category
- Top errors and slow paths — rolled up across all services in the category
It's the same depth of detail as a single-application Overview, but scoped to the group — perfect for team daily-standup checks ("how was checkout overnight?") or product reviews ("how is the search-and-discovery flow holding up under traffic?").
Status rollup
The category-level badge follows the worst-case rule: any service in the category at CRITICAL makes the category CRITICAL. Any WARNING makes it WARNING. Otherwise OK. This means a category badge always reflects the most urgent issue across its members.
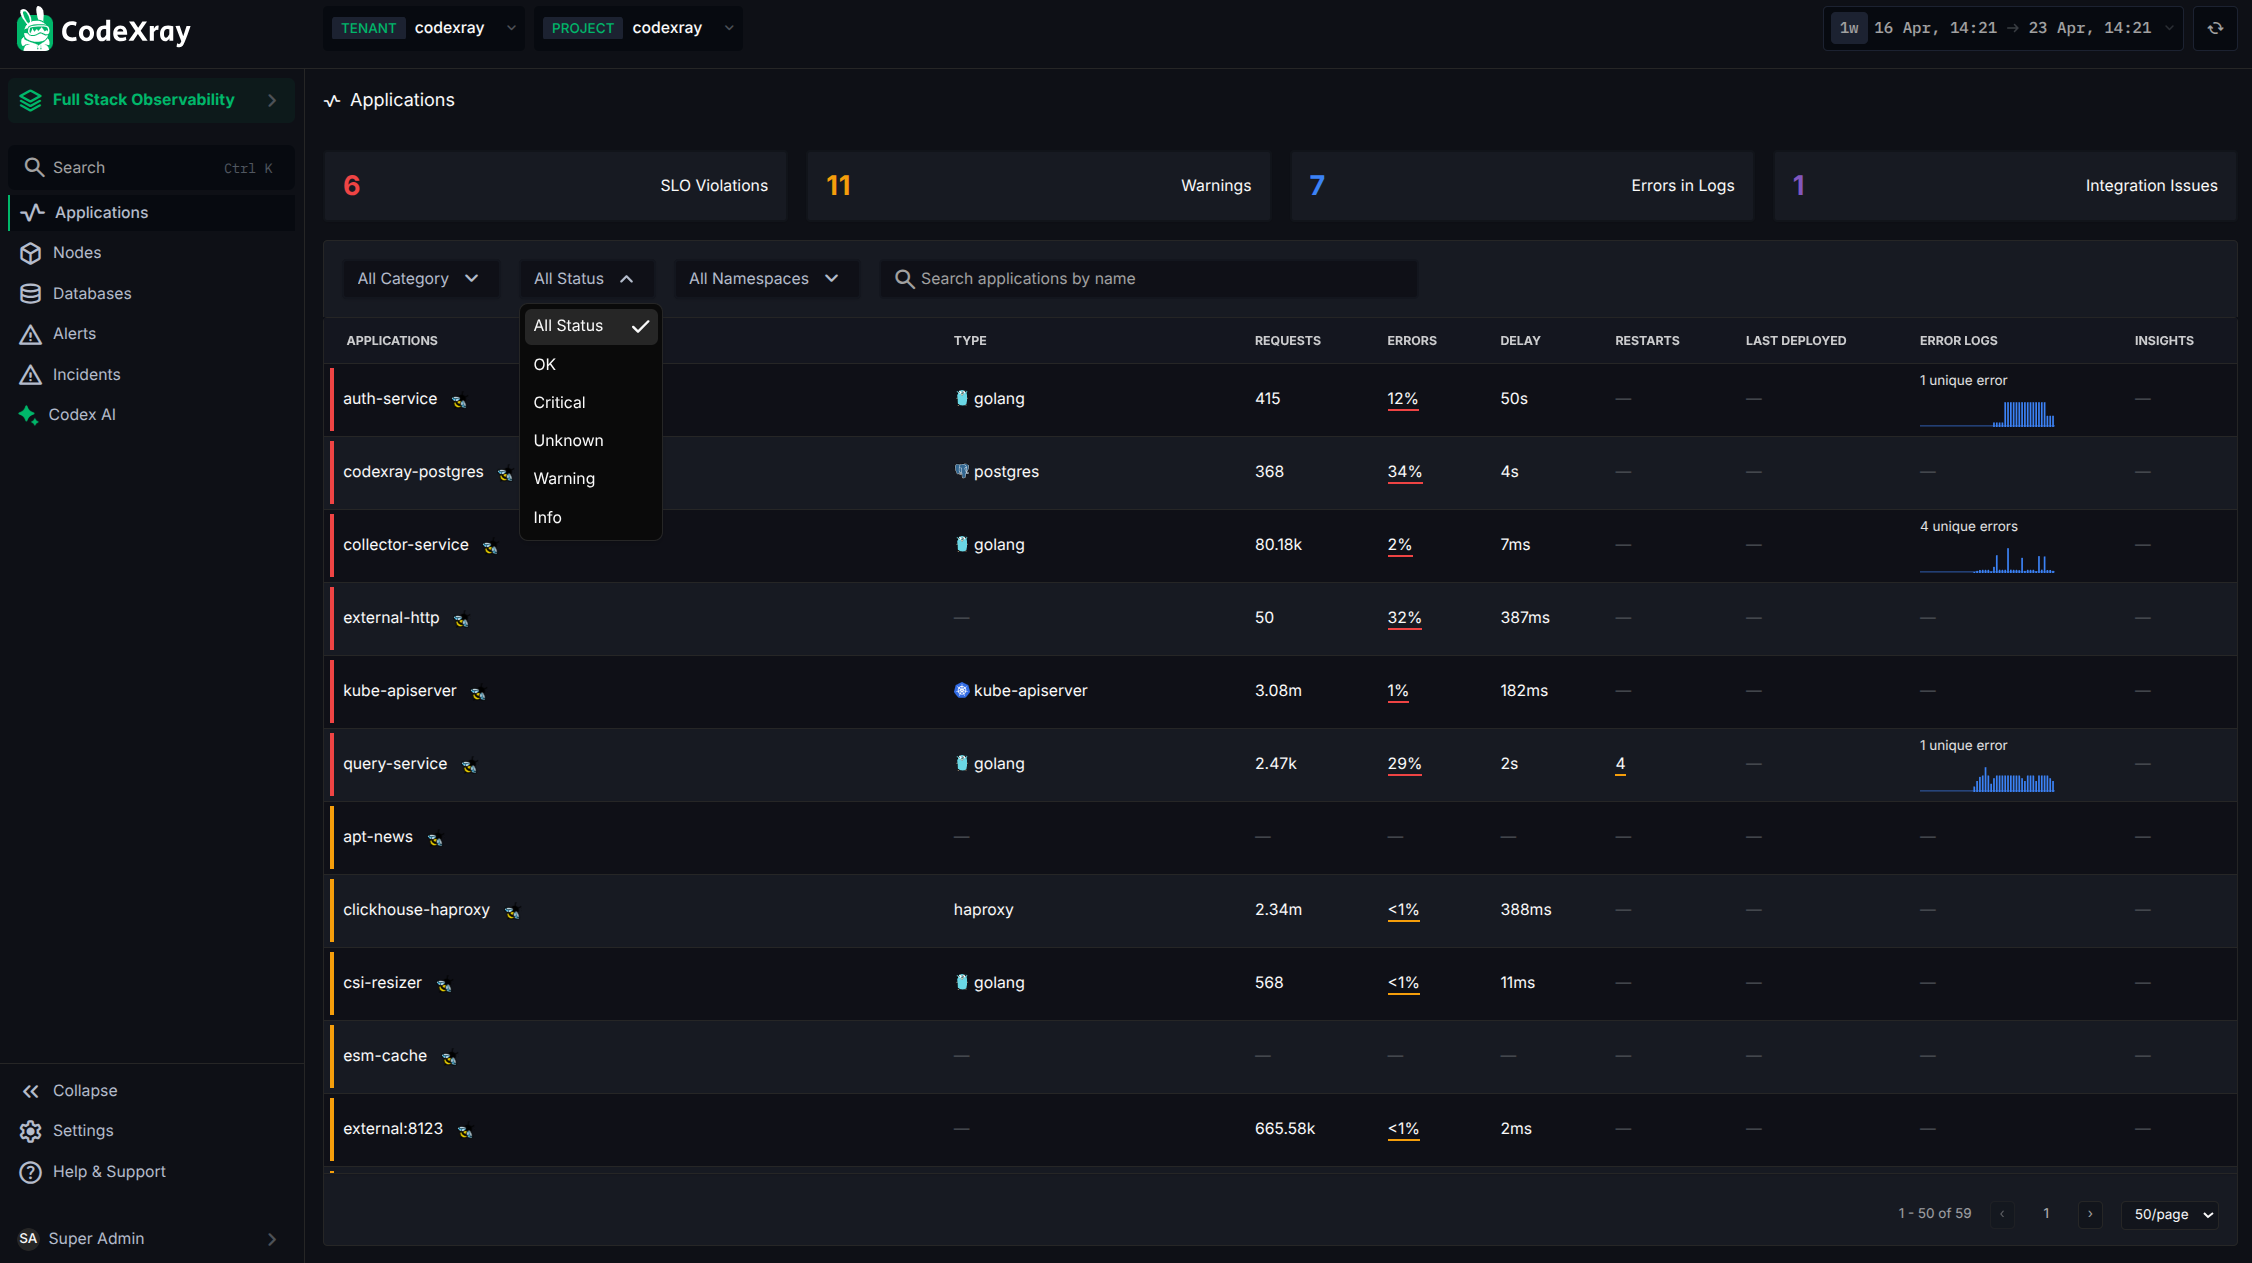
Per-Application Dashboard, From a Category
Click any service in the category dashboard and you drop straight into that service's individual page — without leaving the category context.
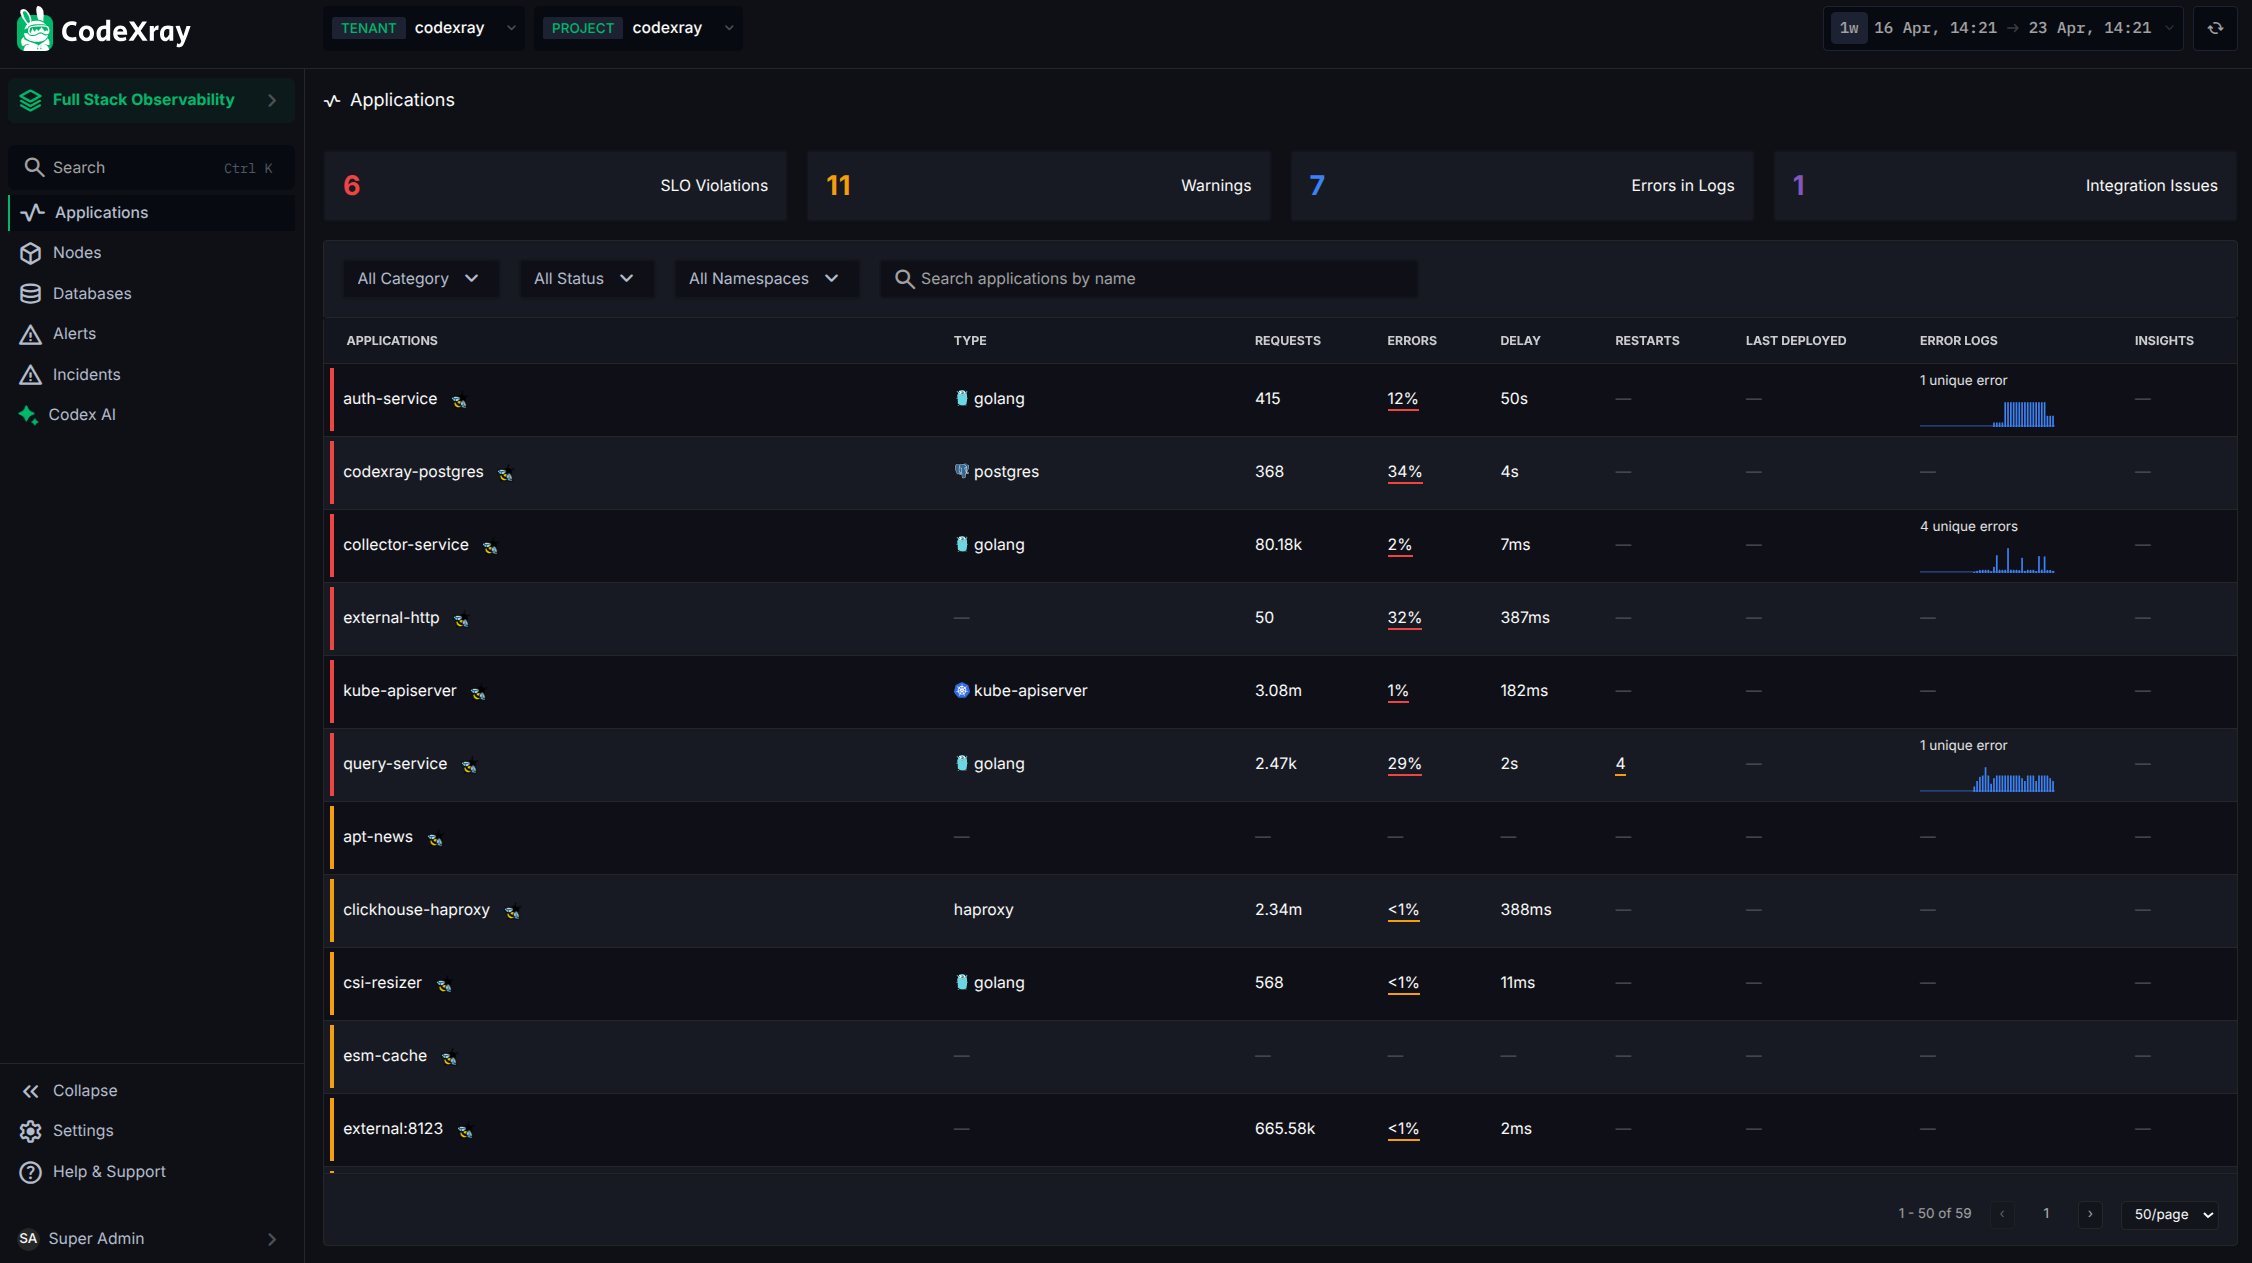
This is the same Application Overview page, but with the category visible in the breadcrumb so you can hop back to the group view with one click.
Topology Filtered by Category
The Topology view (left sidebar) renders the full service map for your project — every service, every dependency, every link. For large fleets, that's a lot to look at.
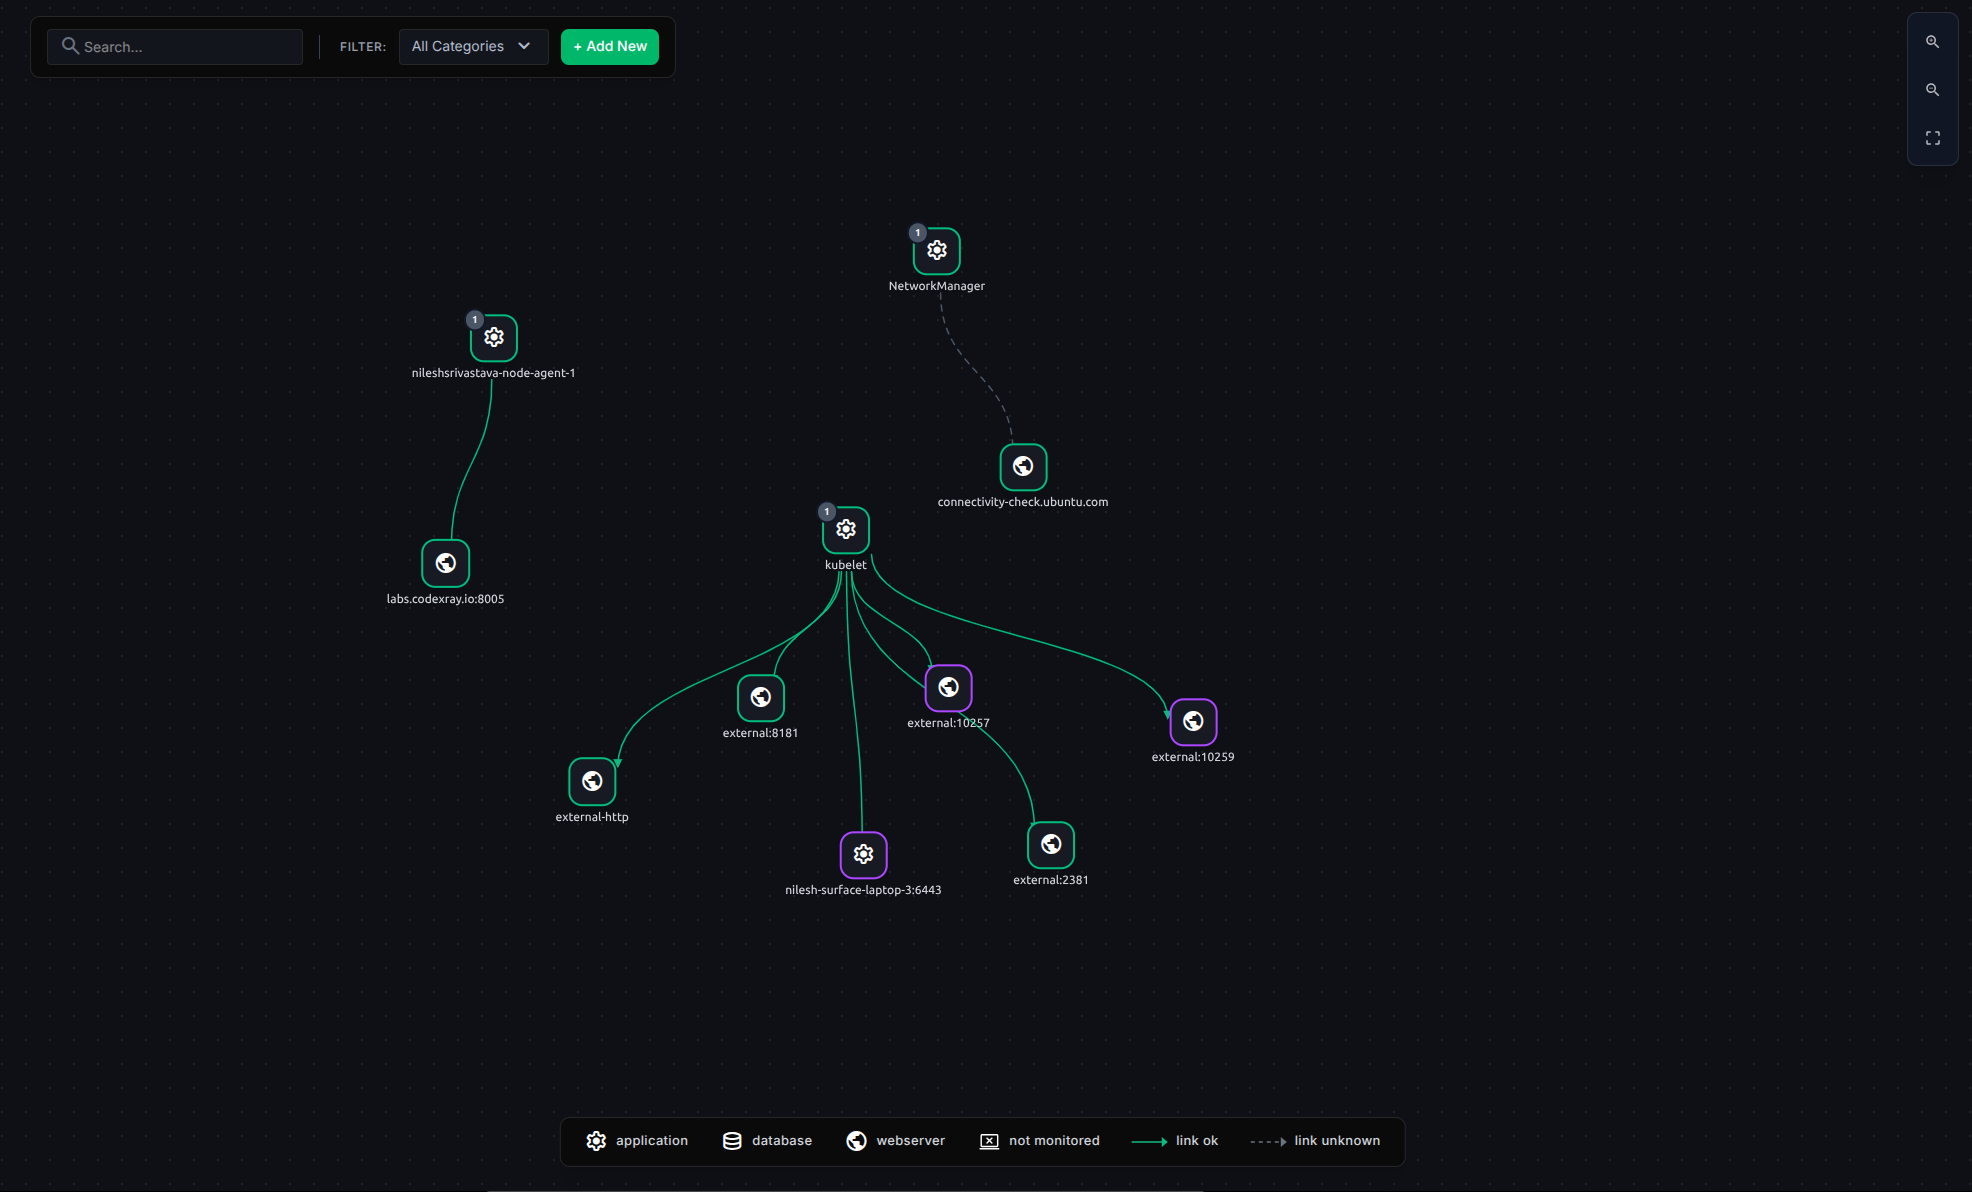
Apply a category filter to scope the map to just the services in one category (and their immediate neighbours). The result is a sharply focused diagram you can actually read.
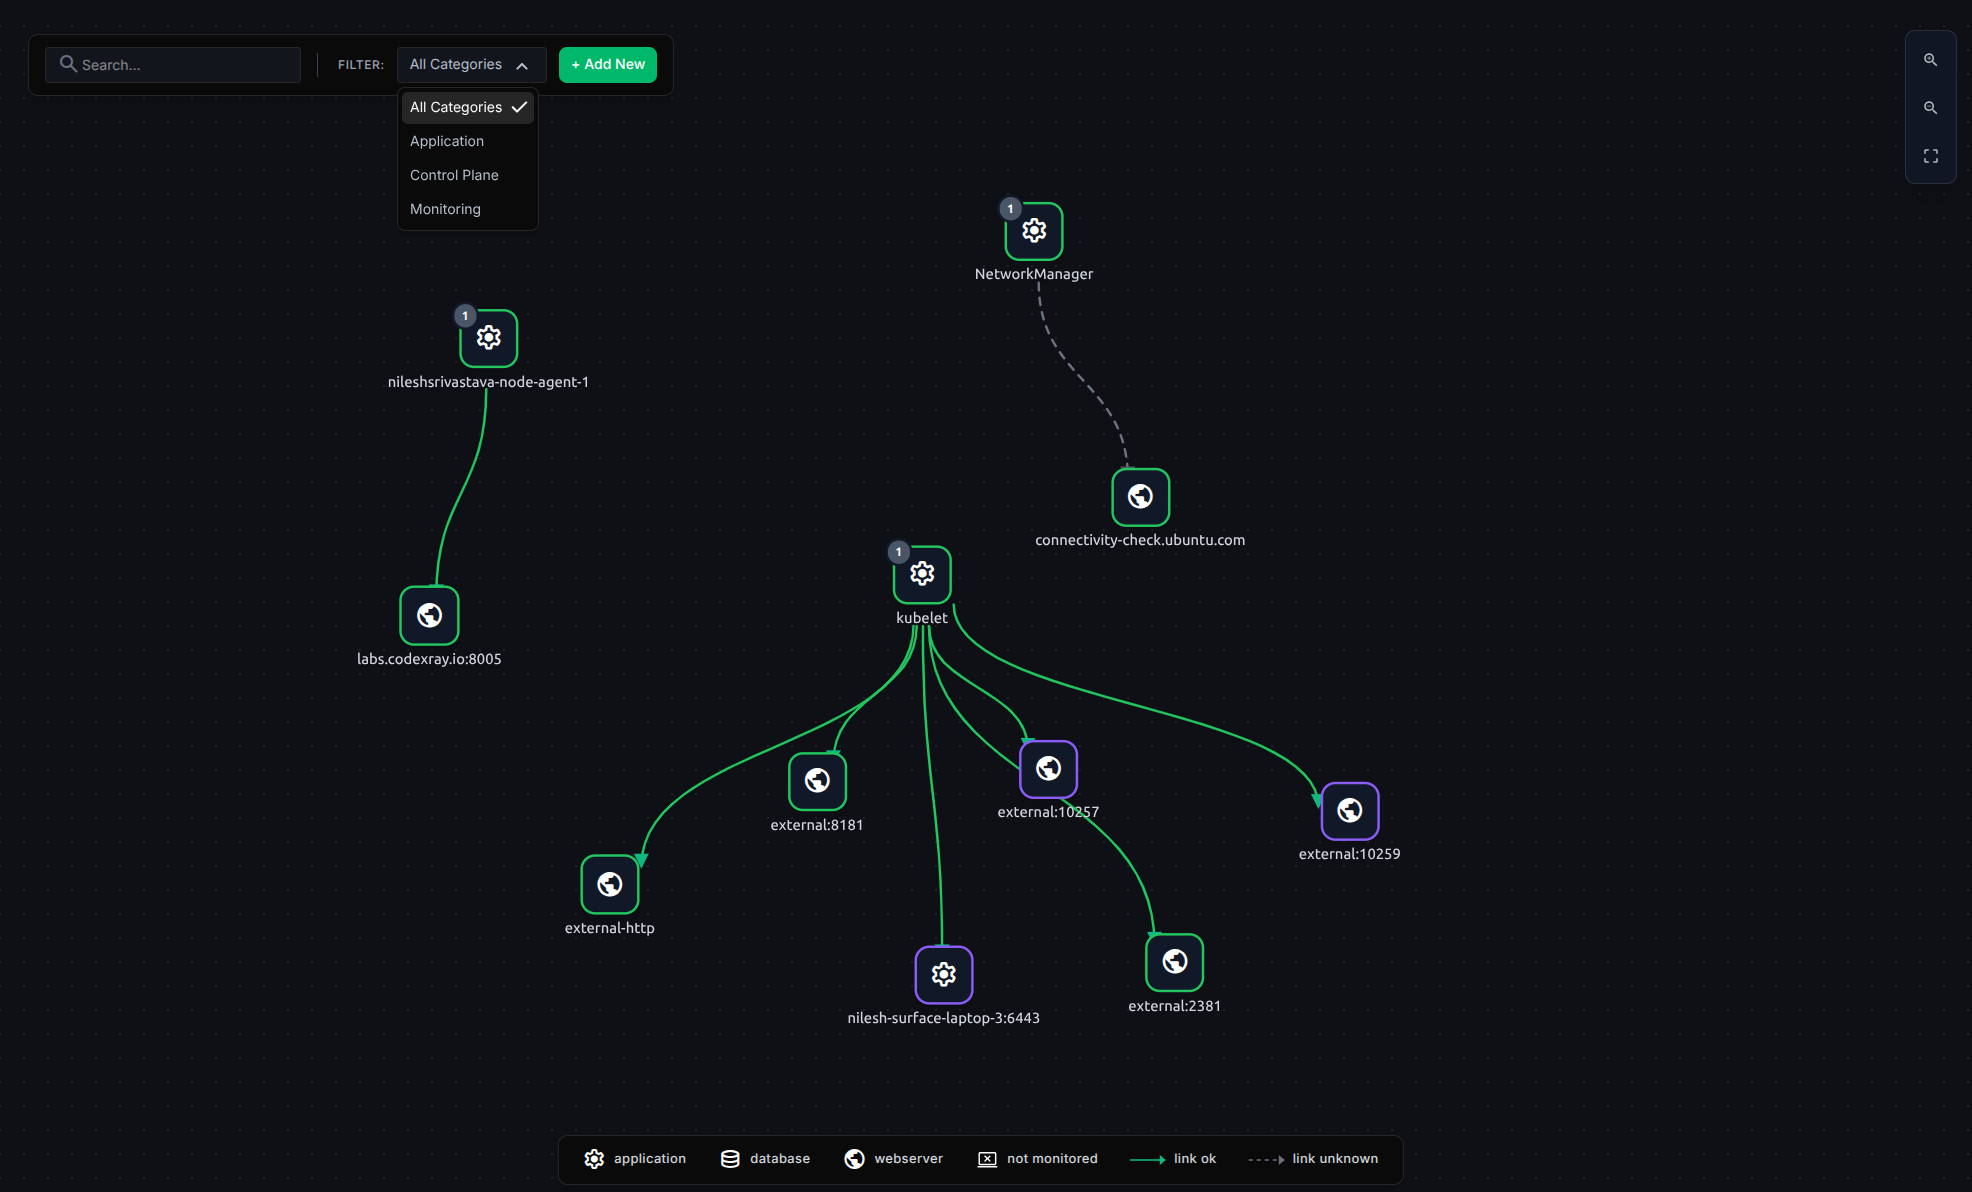
Use category filters when:
- Briefing a team on their services without distraction
- Reviewing a category before a release
- Investigating an incident scoped to one product area
- Onboarding new engineers ("here's the checkout flow")
Common Workflows
"We just split into two product teams — give each their own view"
- Create two categories:
checkout-teamandaccounts-team - Assign the relevant services to each
- Each team uses Settings → Categories → their category as the daily-standup landing page
- Filter Topology by category for releases or incident reviews
"Show me the critical-path services only"
- Create a
tier-1-criticalcategory - Assign your customer-facing critical services
- Open the category dashboard for an at-a-glance critical-path health view
- Optionally configure category-level alert routing to your on-call channel
"I want to track an old vs. new architecture during a migration"
- Create
legacyandmoderncategories - As services migrate, move them from
legacytomodern - Compare RED metrics across categories to confirm the migration is improving things (or not)
- When
legacyis empty, you're done
Categories and RBAC
RBAC applies on top of categories — but is independent of them. Roles control what actions a user can take; categories control how data is grouped. Even a Viewer role sees the categorisation; even an Admin role uses categories for navigation. They're complementary, not hierarchical.
Next Steps
- Custom Applications — the page you'd visit to define applications (vs. organise them, which is what this page does)
- Authentication & Multi-Tenancy — projects and tenants in CodeXray
- Role-Based Access Control — control who can edit category assignments