Incidents — UI Walkthrough
This page is a hands-on tour of the Incidents module. It's the companion to Incidents — Overview, which covers the concepts — what an incident is, how SLOs drive them, severity transitions, and notification routing. Here we'll click through the actual screens that the on-call engineer lives in.
The Incidents module gives you exactly three views: a list for "what's burning?", a detail with Overview + Traces for "why is it burning?", and the application overview for "what objective is it failing?". Everything links to everything; you should rarely need a second tab.
Browsing Incidents — The List View
Open the Incidents module from the left nav. The list is built for triage — the top three counters tell you the shape of your project's health in one glance, and the table lets you sort by the dimension that matters for the question you're asking.
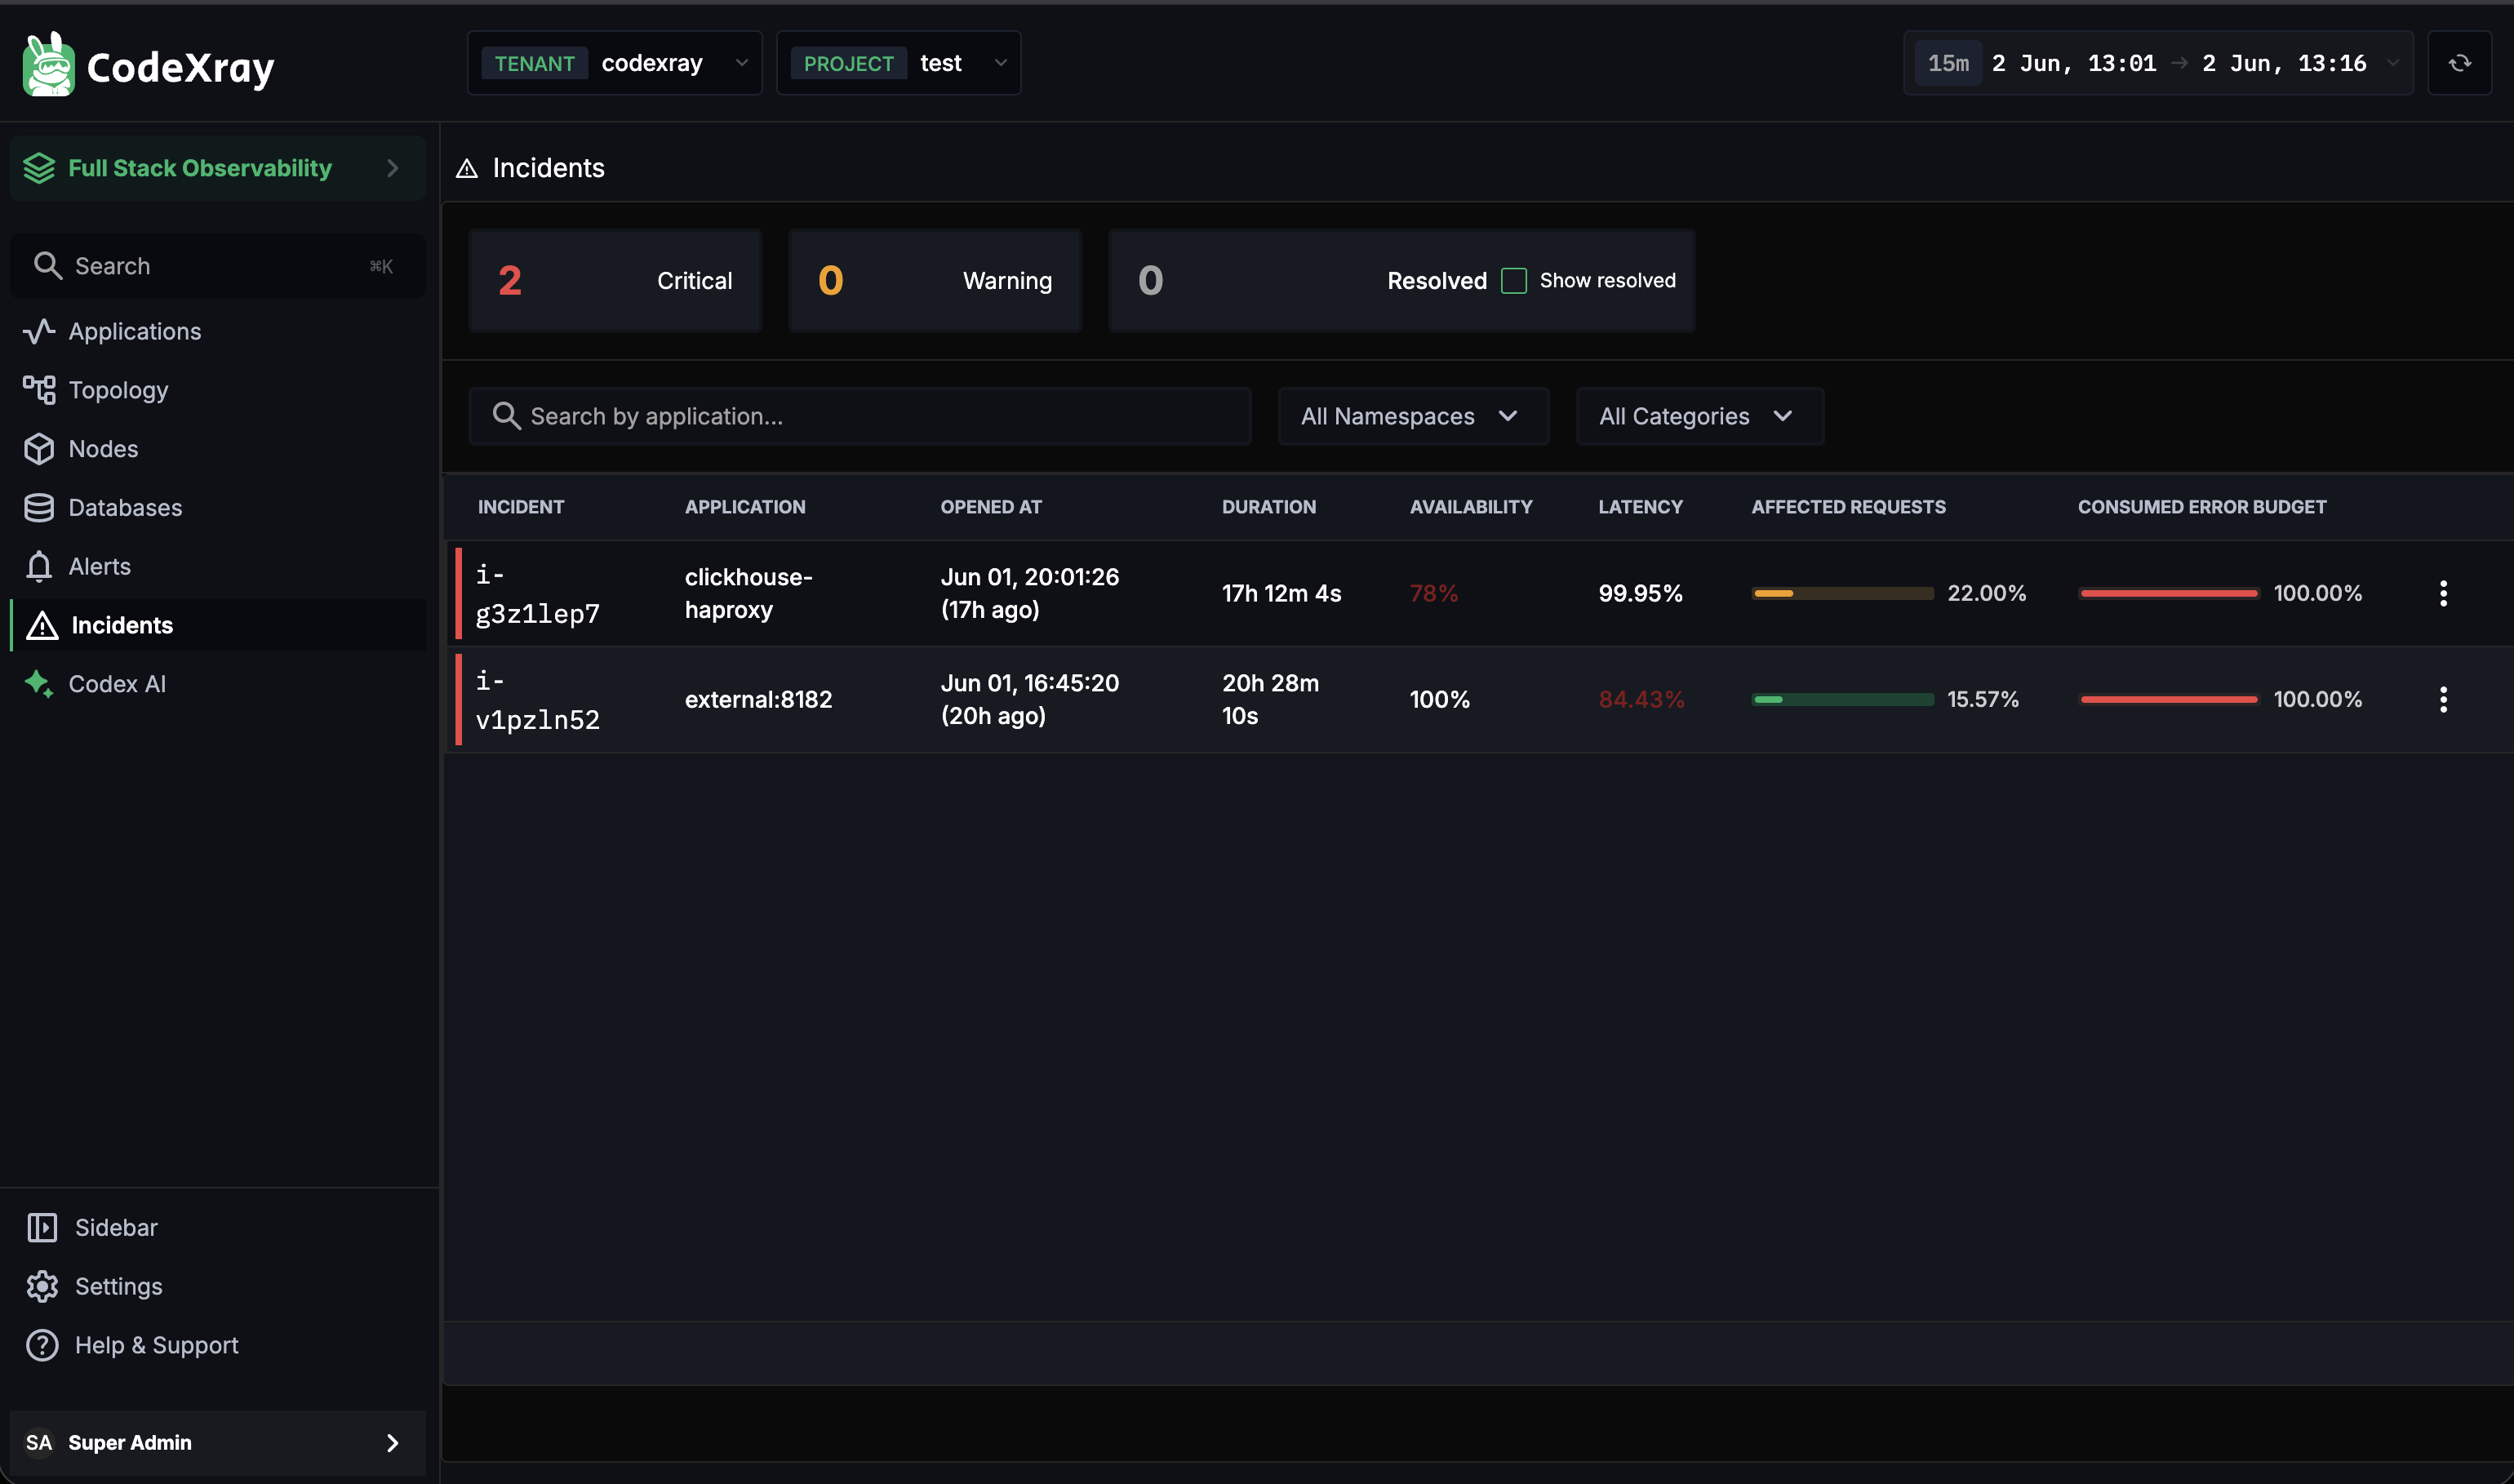
The three status counters
| Counter | What it tells you |
|---|---|
| Critical | Open incidents currently at the highest severity — the ones to look at first |
| Warning | Open incidents at moderate severity — the ones you should look at soon |
| Resolved | Recently resolved incidents (hidden by default; flip Show resolved to surface them) |
Hidden-by-default for Resolved is intentional — the list is a working-set view, not a history archive. Flip the toggle when you're investigating a recurring pattern.
Filters
Three filters narrow the table:
| Filter | Use it when |
|---|---|
| Search by application | You know the service that's likely impacted and want to skip past unrelated noise |
| All Namespaces | The incident is scoped to a specific Kubernetes namespace (payments-prod, ingest-staging) |
| All Categories | Your project uses application categories — narrow to a single category like Customer-facing |
The columns
Each row is one incident. The seven columns are designed so you can size up an incident without clicking through to detail:
| Column | What it answers |
|---|---|
| Incident | The short ID (e.g. i-g3z1lep7) — also the URL slug for the detail view |
| Application | Which service is burning. External dependencies appear here too, in the form external:<port> |
| Opened at | Both the absolute timestamp and a relative "17h ago" — sort here when you want oldest-first |
| Duration | How long this incident has been open. Long durations signal a service that's been quietly broken |
| Availability | Current Availability SLO compliance — values below the objective are highlighted red |
| Latency | Current Latency SLO compliance — same colouring rule |
| Affected Requests | What share of total requests have been impacted — a small bar gauge, percent label |
| Consumed Error Budget | How much of the application's monthly error budget this incident has burned. 100% means the budget is gone — every future error in the cycle is a violation |
The kebab menu on each row links to incident actions (open detail, copy link).
If you can only afford to look at one incident, sort by Consumed Error Budget descending. That column ranks incidents by how much real damage they're doing to the SLO promise — not just by severity, which can flicker.
Inside an Incident — The Overview Tab
Click any incident in the list to open the detail view. The Overview tab is built to answer "why is it burning?" — every visible chart is scoped to the incident's time window, so you don't have to dial date pickers to investigate.
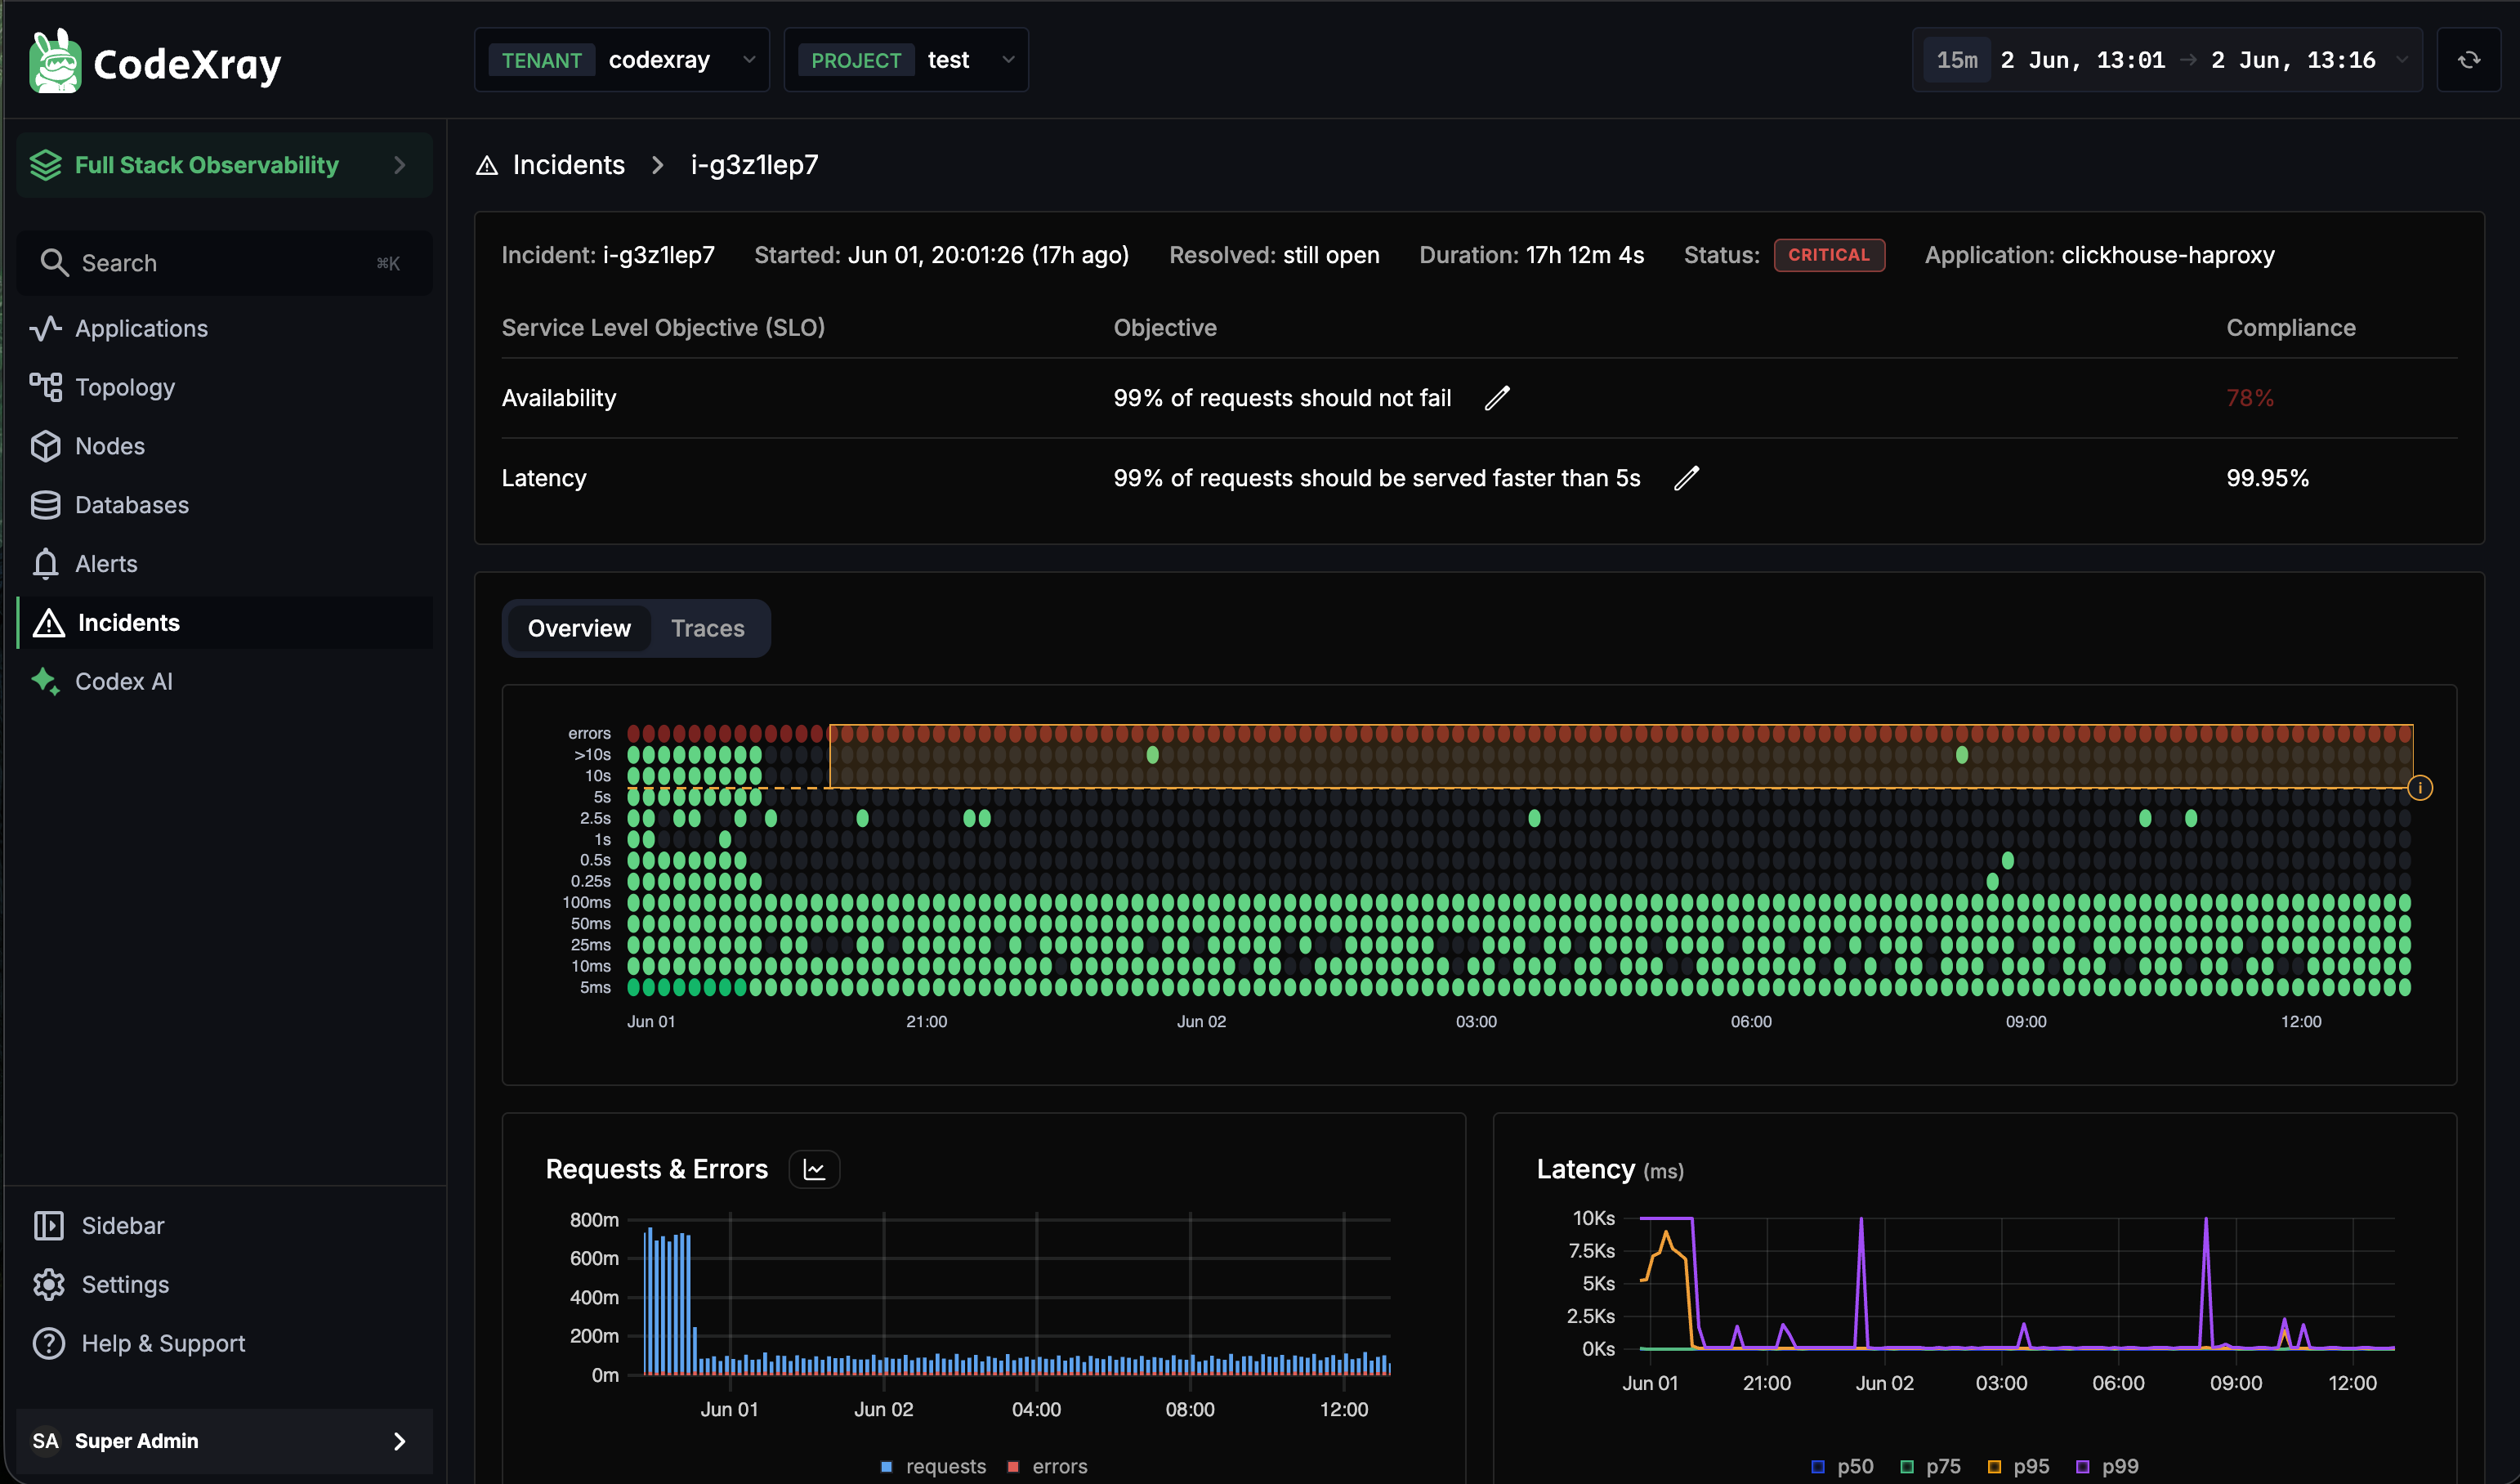
Header — the seven facts
The header bar packs the seven things you want to know in the first two seconds:
| Field | Example |
|---|---|
| Incident ID | i-g3z1lep7 — copy-friendly handle for chat and tickets |
| Started | Jun 01, 20:01:26 (17h ago) |
| Resolved | still open, or the resolution timestamp |
| Duration | Live counter while open — 17h 12m 4s |
| Status | CRITICAL / WARNING / RESOLVED badge — current severity |
| Application | The service this incident is scoped to |
Service Level Objective table
The next block shows both SLOs configured for this application with their plain-English objective and the live compliance value:
| SLO | Example objective | Compliance | Notes |
|---|---|---|---|
| Availability | 99% of requests should not fail | 76% (red — below objective) | Compliance below the objective triggers Availability-driven incidents |
| Latency | 99% of requests should be served faster than 5s | 99.95% (green — meeting objective) | Healthy latency in this example — so this incident is purely an availability burn |
Each row has a pencil icon — clicking it opens the SLO Config dialog for this application, so you can tune the objective directly from the incident view. The change applies to the application's future evaluation, not retroactively to this incident.
A glance at the compliance column tells you which SLO is doing the burning. If Availability is red and Latency is green (like the example above), don't waste time pulling apart latency histograms — you have an error-rate problem, and the Requests & Errors chart is the one that matters.
Latency heatmap
The large grid below the SLO table is a latency heatmap for the affected application across the incident window:
- Y axis — latency buckets (10ms, 50ms, 100ms, … up to 25s+)
- X axis — time, from incident open to now
- Cell colour — request volume into that latency bucket at that time, with green for healthy, red for unhealthy
The heatmap is the fastest way to spot whether the burn is steady (every column looks similar) or bursty (alternating dense red bands and quieter green stretches). Burst patterns usually point at retry storms, backpressure, or a degraded dependency cycling.
Requests & Errors and Latency charts
Below the heatmap, two summary charts close out the Overview:
- Requests & Errors — request volume and error volume side-by-side. Severity transitions on the incident usually line up with visible jumps in the error series.
- Latency —
p50/p75/p95/p99percentile lines. For Latency-driven incidents,p99is the one that matters; for Availability-driven incidents this chart is context.
Inside an Incident — The Traces Tab
Switch to the Traces tab on the same detail page when you've sized up the incident and need to find a single failing request to chase. CodeXray pulls sampled traces from within the incident's time window so you don't have to time-range-match by hand.
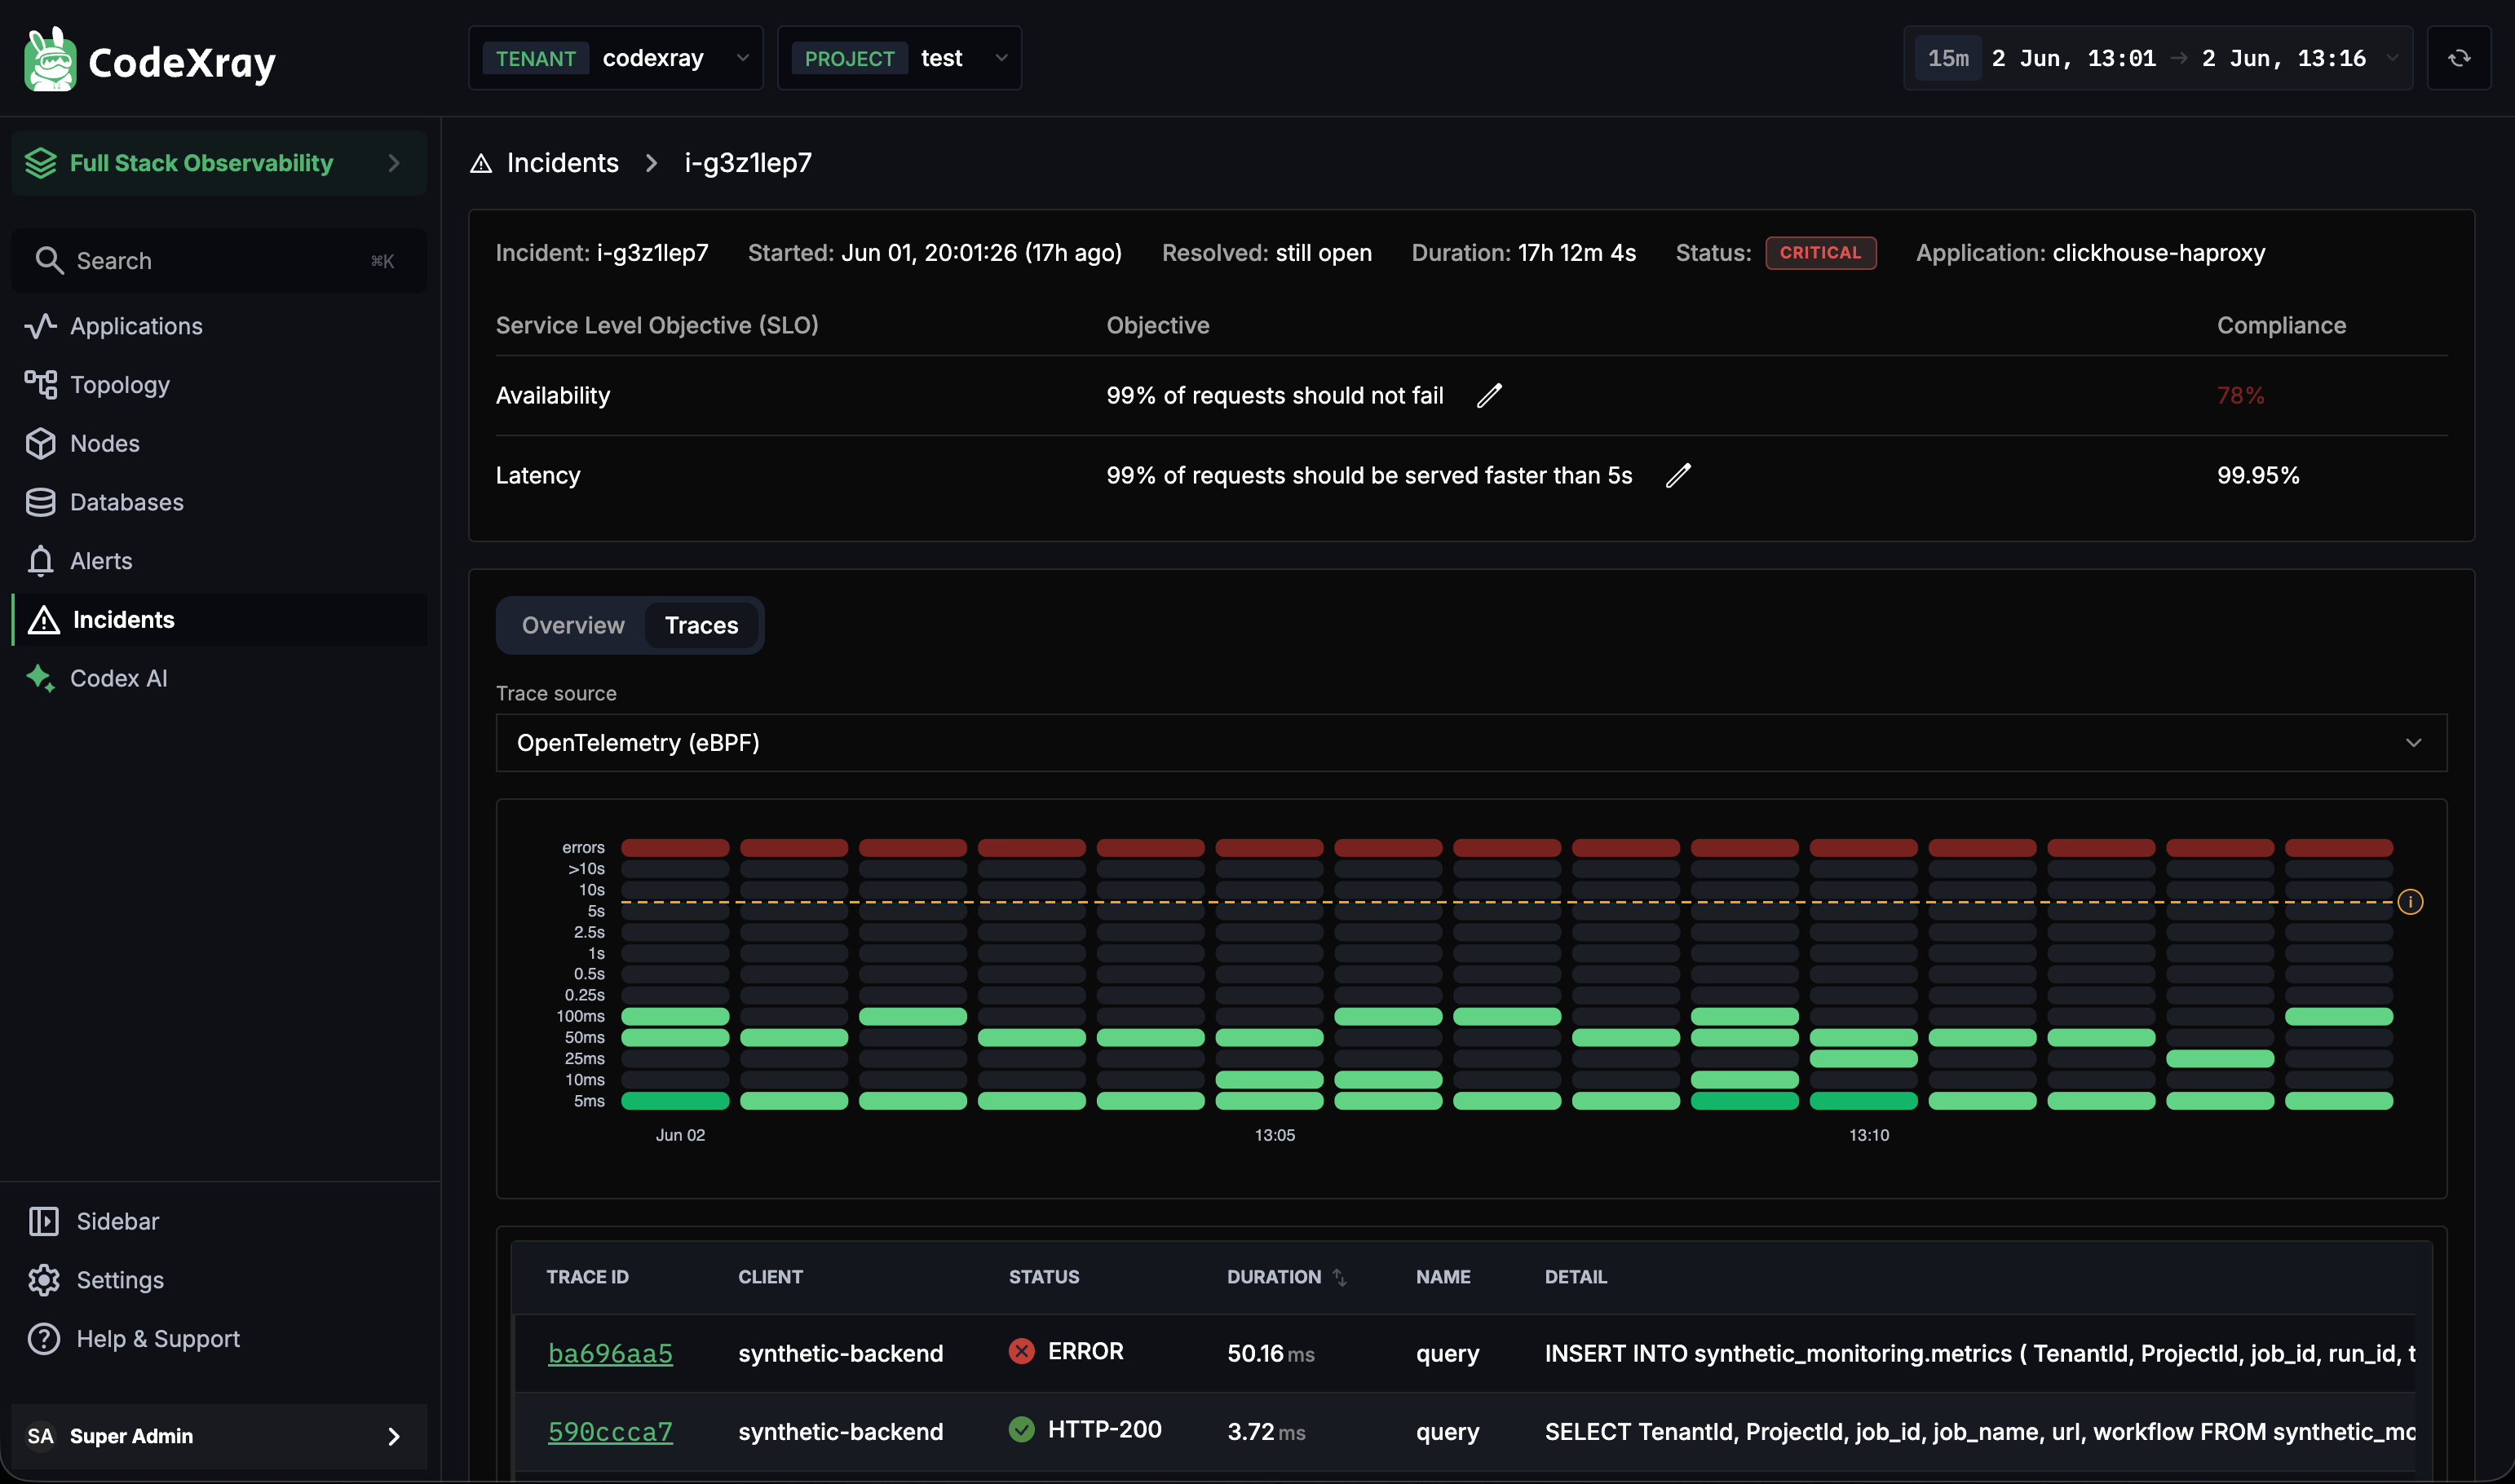
Trace source
The Trace source dropdown at the top picks where the traces come from:
| Source | When to pick it |
|---|---|
| OpenTelemetry (eBPF) | Available on every monitored service automatically — no SDK required. The default. |
| OpenTelemetry (SDK) | If your service is instrumented with the OTel SDK, this gets you trace data with the full custom-span context |
If a service has both sources, picking the SDK option usually gets you richer span attributes; the eBPF source is the safety net for services that aren't instrumented.
The trace list
The sampled traces appear under the heatmap. The columns are designed for incident triage:
| Column | What you do with it |
|---|---|
| Trace ID | Click to open the full trace in the trace viewer with the incident time range already applied |
| Client | Which upstream caller initiated the request — useful when one client is responsible for the burn |
| Status | ERROR (red) vs HTTP-200 (green). For Availability incidents, sort/filter by ERROR first |
| Duration | How long this specific request took. For Latency incidents, sort descending |
| Name | The operation name (query, GET /api/orders, etc.) |
| Detail | The actual statement — the SQL for database calls, the path for HTTP calls. Often diagnostic by itself |
The traces shown are samples, not the full firehose. The goal isn't to see every failing request — it's to find one or two that are representative, click into the full trace, and identify which downstream span is slow or erroring. The Overview tab tells you what is wrong; the Traces tab tells you where.
Where SLOs Live — The Application Overview
SLOs are configured per application, not globally. To open or edit an application's SLOs, navigate to Applications → <your app> and look at the top right of the Overview tab.
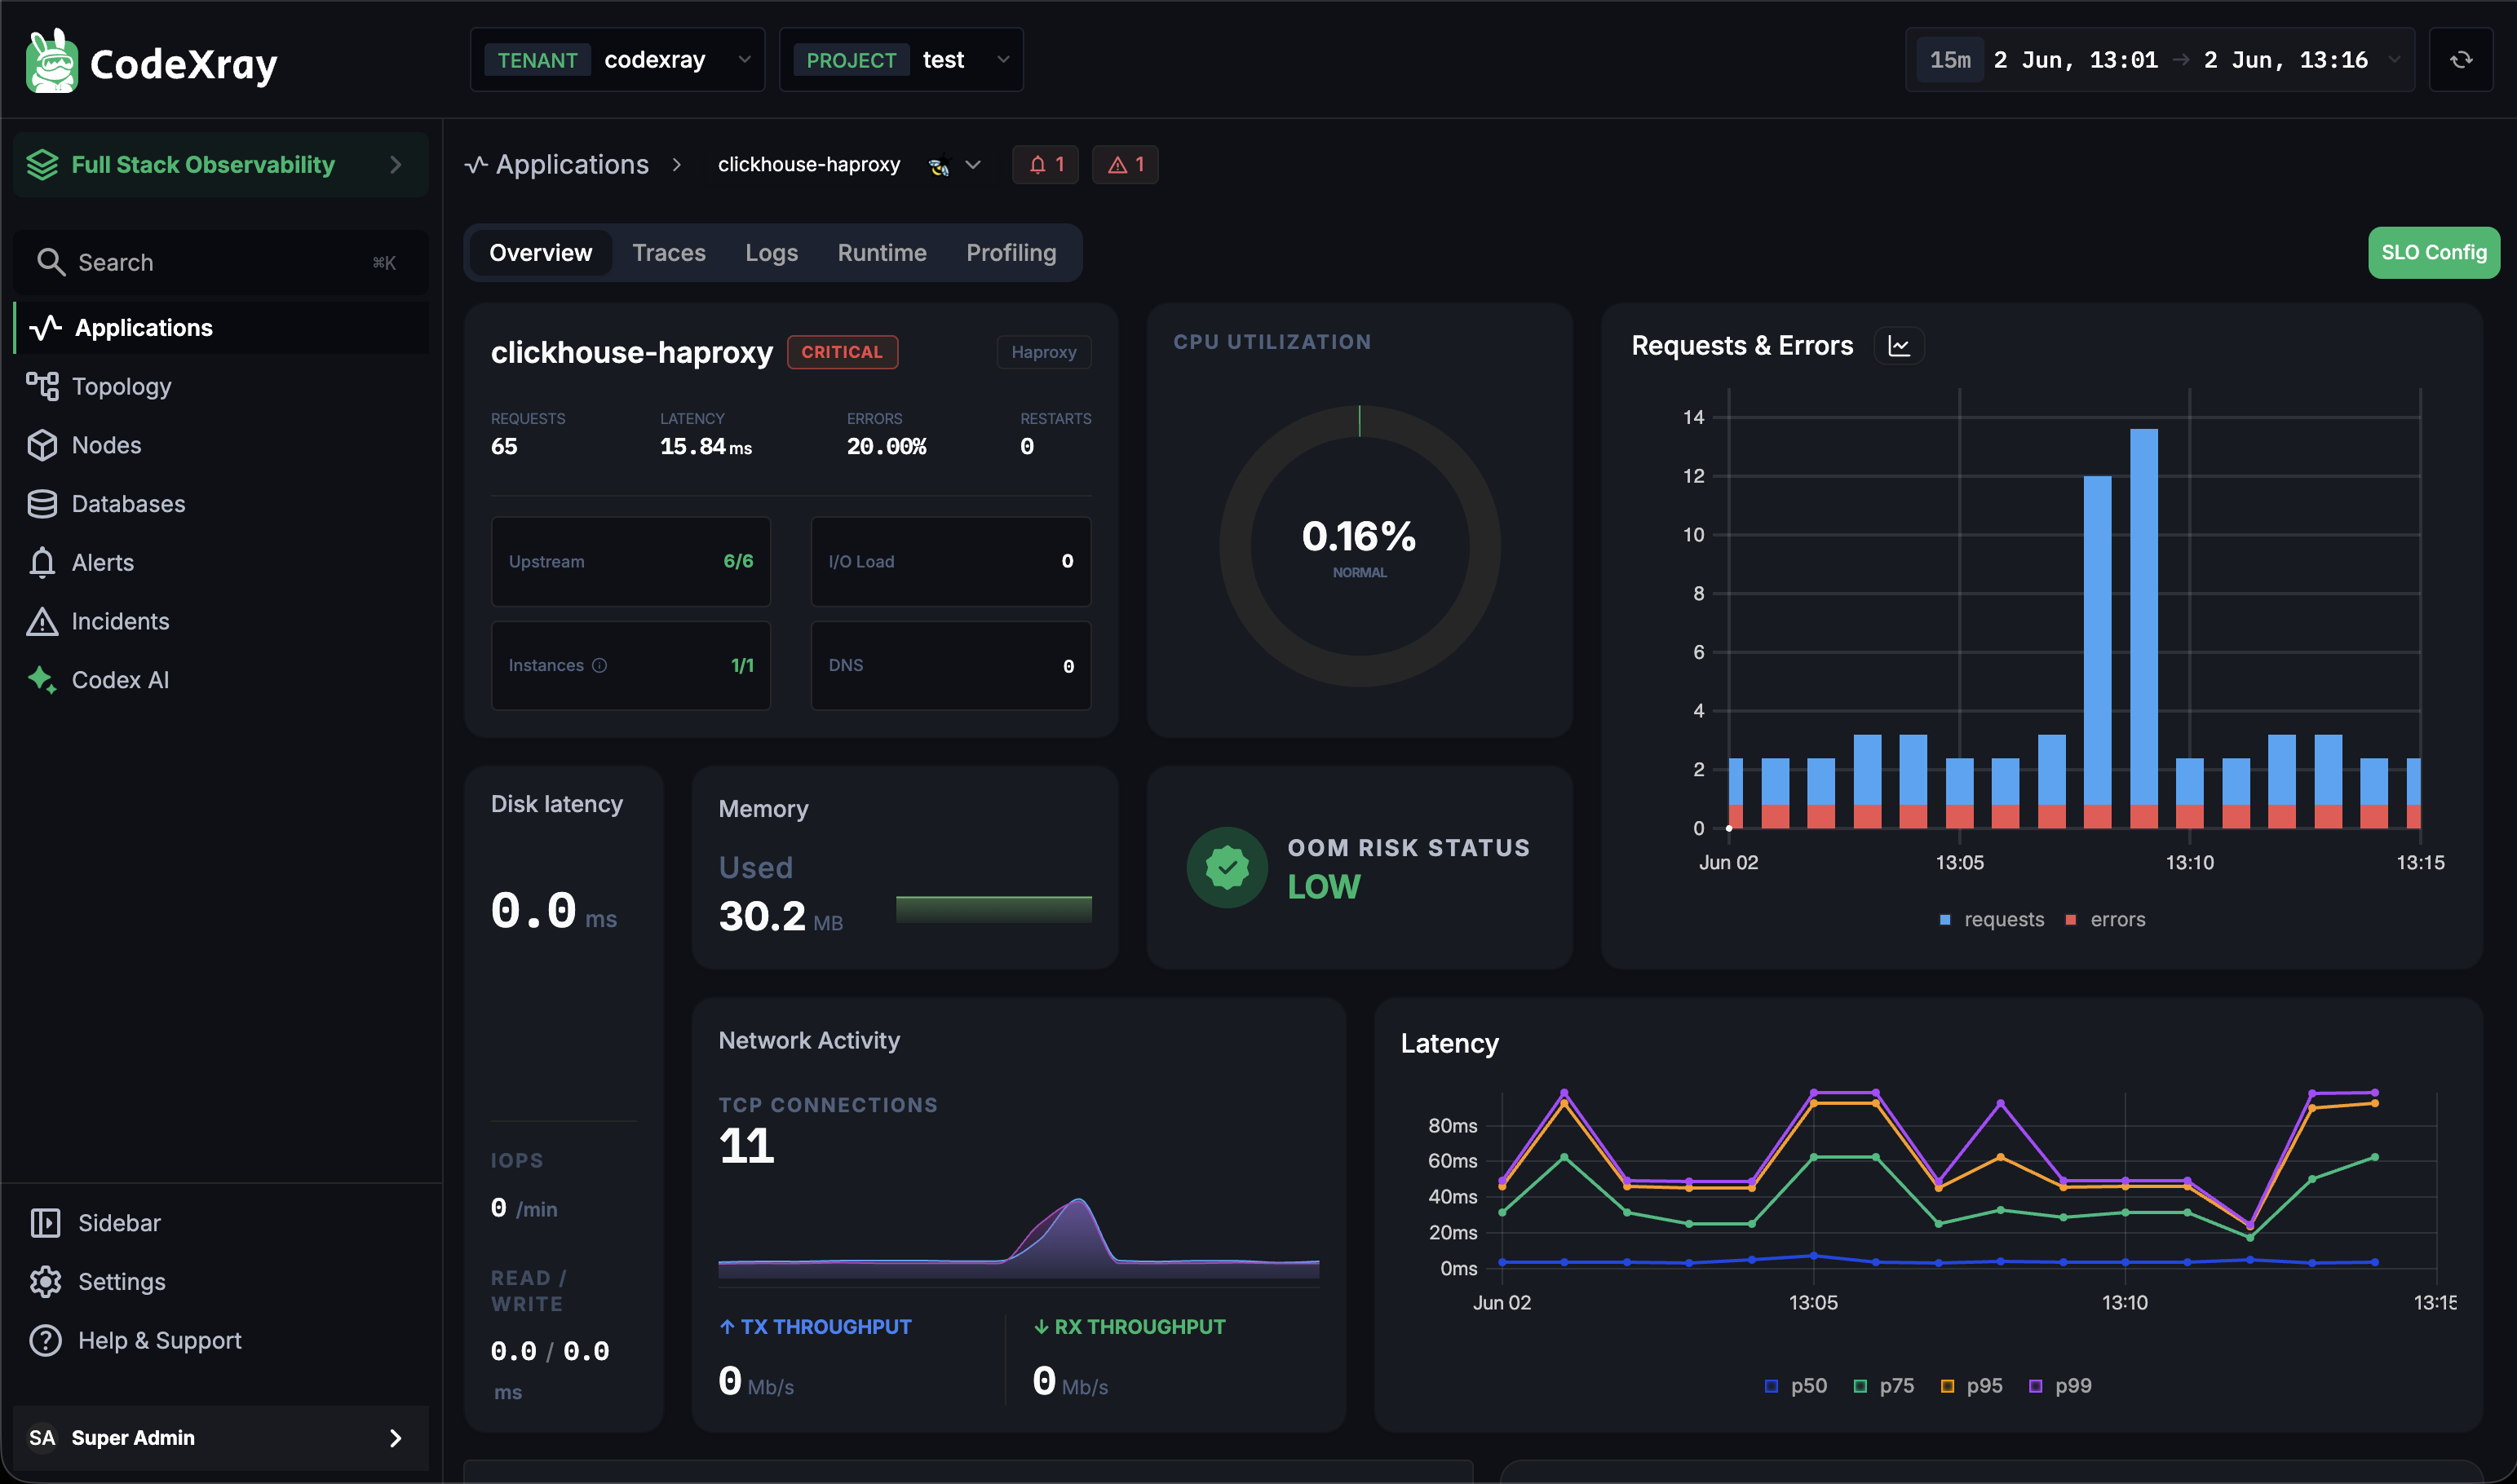
Three things in this view directly tie back to Incidents:
1. The SLO Config button
The green SLO Config button at the top-right of the application overview opens the same dialog you'd reach by clicking a pencil on the incident detail. Set the Availability objective (e.g. 99.5%) and the Latency objective + bucket (e.g. 99% under 5s) for this application. Changes take effect on the next SLO evaluation cycle — no restart, no apply step.
You can open the SLO Config dialog from the application (the button shown here) or from any incident for that application (the pencil icons on the SLO table). They open exactly the same dialog with the same values — both are saved against the application.
2. The inline severity badge
Notice the CRITICAL badge right next to the application name clickhouse-haproxy. Every application that has an open incident shows this badge inline — red for Critical, yellow for Warning, grey for recently resolved. It's the cheapest signal that the application you're about to investigate is already known to be unhealthy.
3. The top-right alert + incident counters
In the top-right header, next to the time-range selector, you'll see:
- A bell icon with a count (alerts currently firing for this application)
- A triangle icon with a count (incidents currently open for this application)
These are clickable shortcuts straight back into the Alerts and Incidents modules, scoped to this application — useful when you're already inside an app and want to jump out to the related fires without losing context.
A Typical Triage Flow
Putting the views together, a common path through the module during an active burn:
- Open Incidents. Look at the three counters first — Critical: 2, Warning: 0 tells you to skip filtering and just scan the table.
- Sort by Consumed Error Budget descending. Click into the row with the highest burn — that's the one doing the most real damage.
- Read the SLO compliance table on the detail page. Decide whether you have an availability problem or a latency problem before you look at any chart.
- Scan the heatmap. Steady or bursty? Bursty narrows the cause to retries / backpressure / a flapping dependency.
- Switch to Traces. Sort by ERROR (for Availability) or Duration descending (for Latency). Open one or two representative traces in the trace viewer.
- If you find the issue and the fix is a target change, click the pencil on the SLO table to adjust the objective — but only if the new target is the right number for the business, not because you want to silence the burn.
- Let the system resolve. When the burn rate returns to healthy, the incident closes itself; the on-call channel gets the resolve notification automatically.
Next Steps
- Incidents — Overview — the concepts, the lifecycle, the channel routing
- Alerts — UI Walkthrough — the same channel modal controls incident routing via the
Incidentstoggle - Application Categories — what powers the
Categoryfilter on the Incidents list