Alerts — UI Walkthrough
This page is a hands-on tour of the Alerts module in CodeXray. It's the companion to Alerts — Overview, which covers the concepts behind built-in inspections, custom rules, and notification channels. Here we'll click through the actual screens — listing rules, creating a new one, configuring a channel, and investigating a fire.
The Alerts module is organised into three tabs — Alerts (currently firing and history), Rules (definitions for what to detect), and Notifications (where notifications go). Everything you'll do lives inside this single navigation.
Browsing Rules — Built-in
Open Alerts → Rules and you land on the Built-in sub-tab. These are the 25 inspection-backed rules that ship with every CodeXray project — enabled by default, tuned with safe production defaults, and ready to fire.
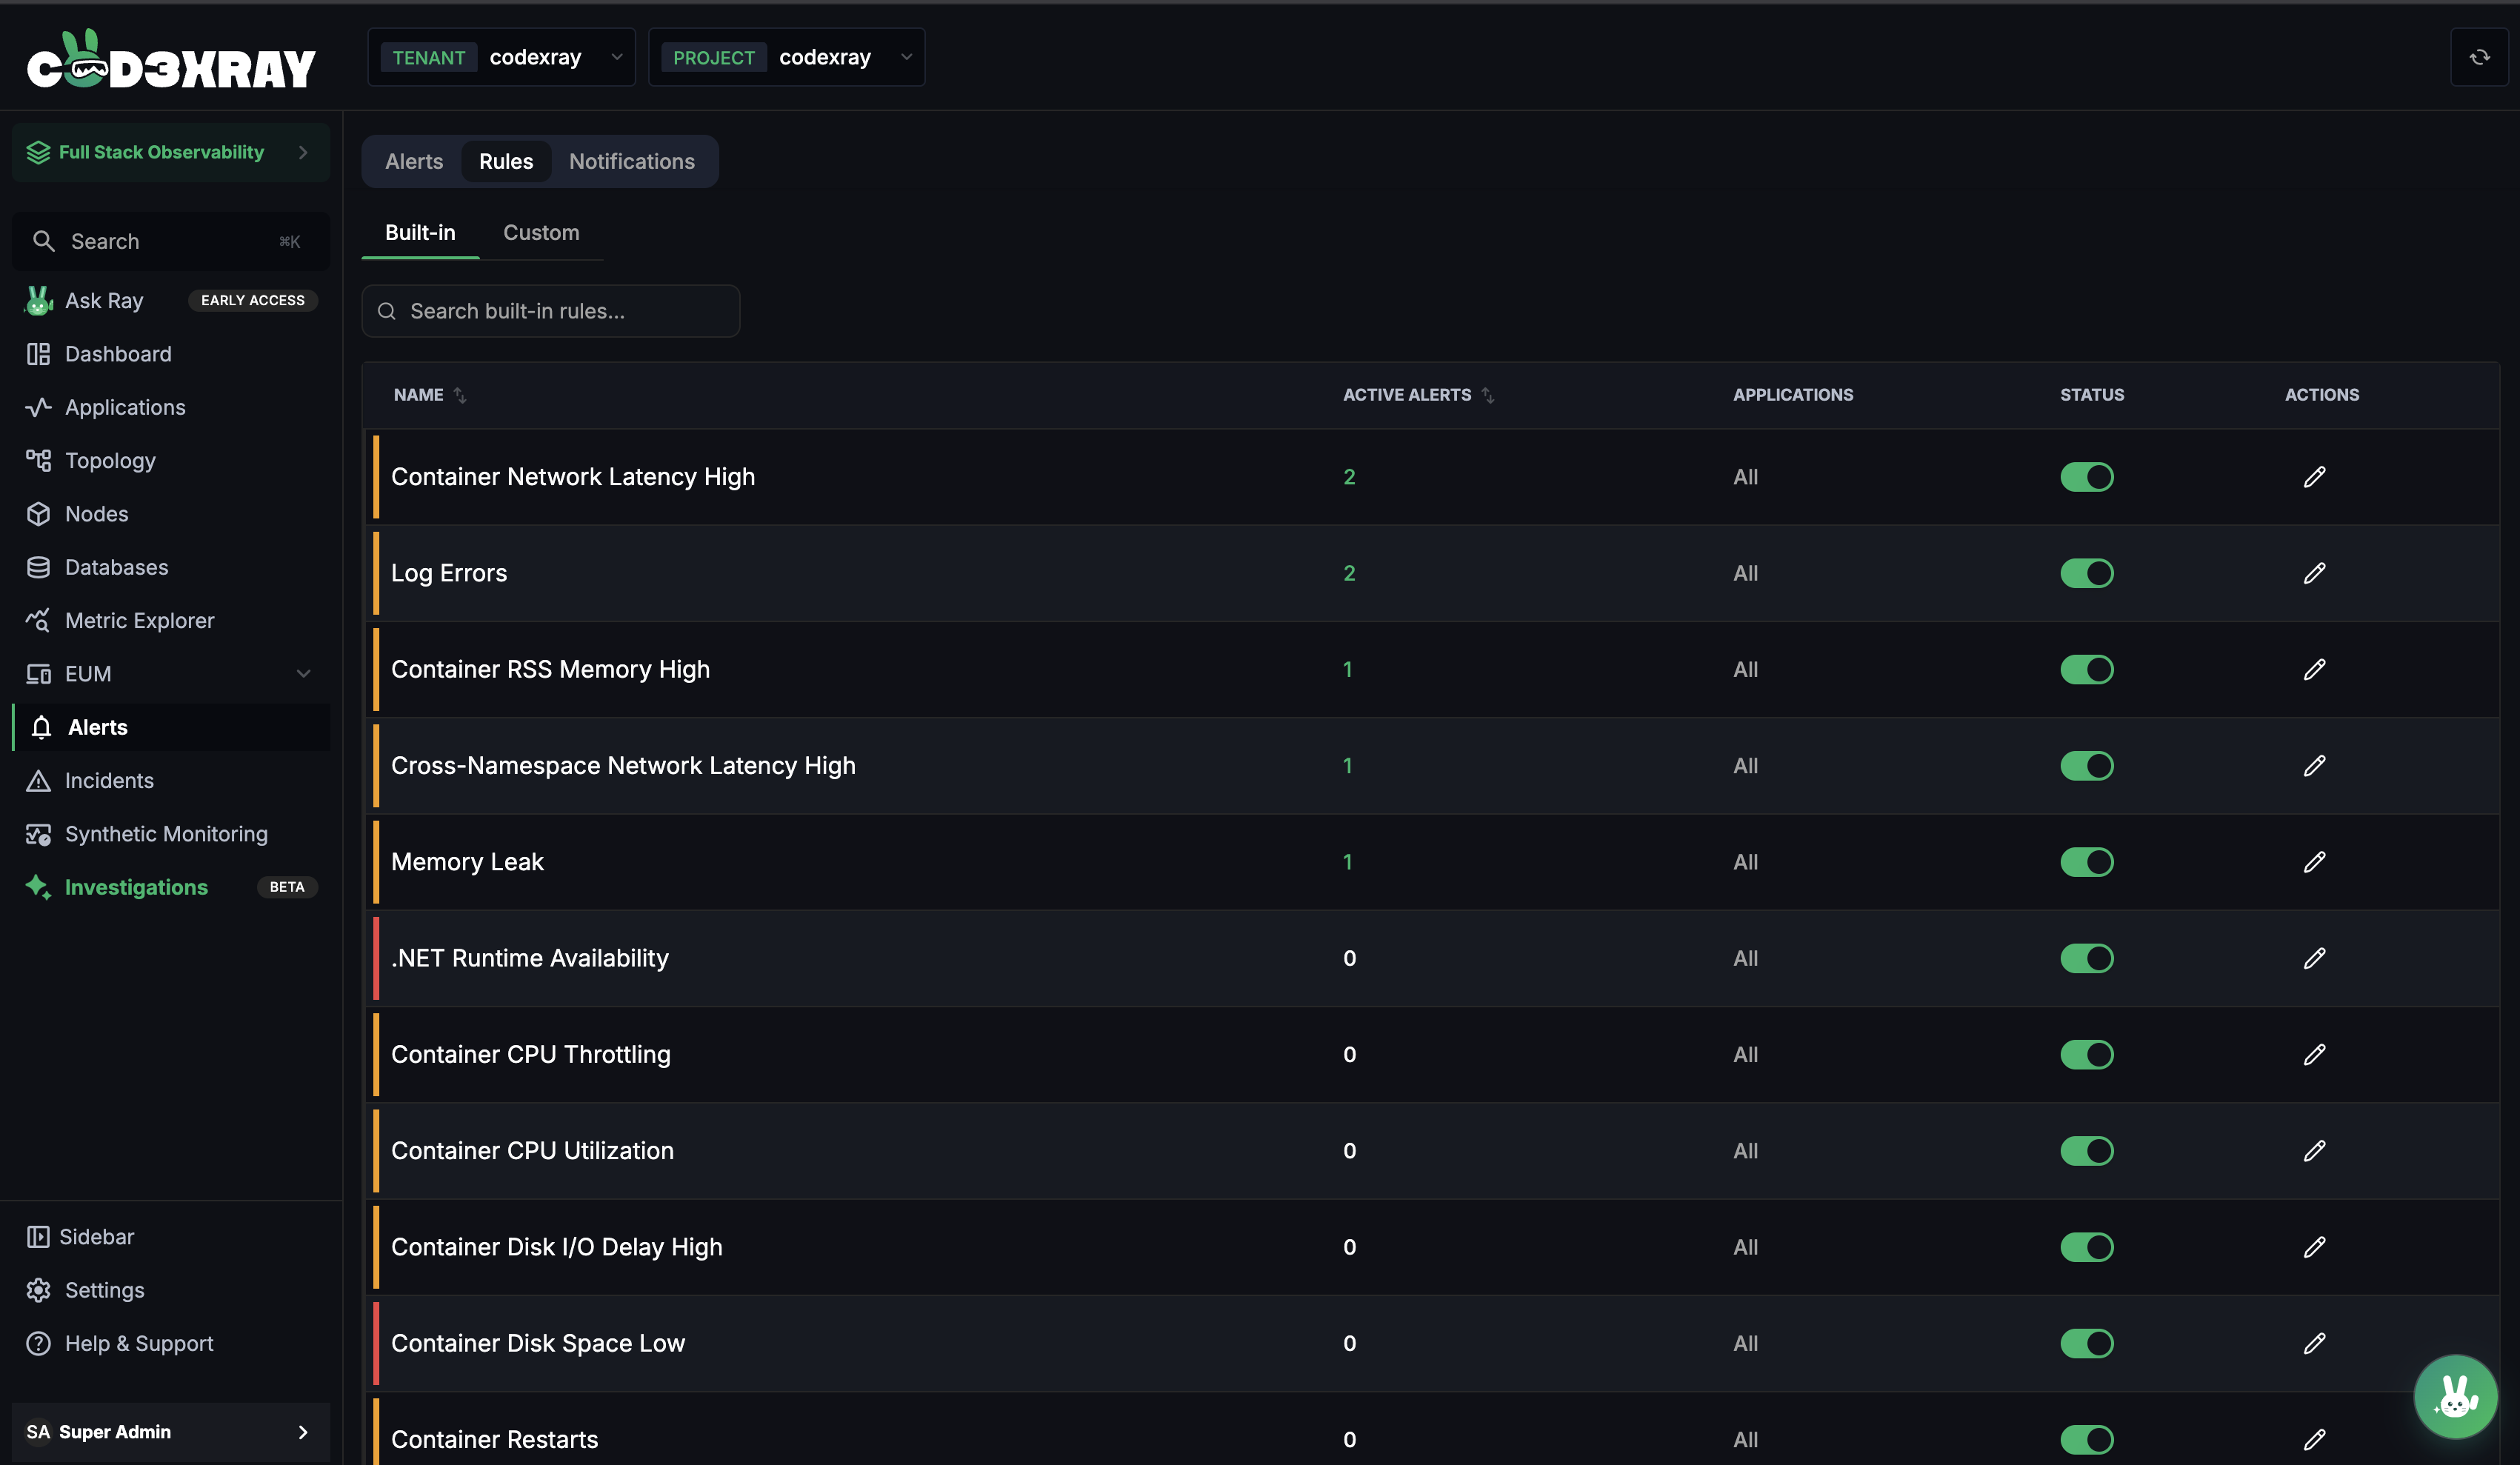
Each row in the table tells you, at a glance:
| Column | What it shows |
|---|---|
| Name | The human-readable rule name (e.g. Container CPU Throttling) |
| Active Alerts | How many alerts this rule has currently firing across the project |
| Applications | The scope — All if the rule applies project-wide, or a specific application list |
| Status | Toggle to enable or disable the rule without deleting it |
| Actions | Pencil icon → open the rule for editing |
Click the pencil to override severity, durations, scope, or attached notification channels for any built-in rule. The underlying inspection logic stays the same — you're only adjusting how and when it fires.
Before you start writing custom rules, walk through the Built-in list once. You'll often find that a small tweak — narrowing scope to a specific deployment, or attaching a Slack channel — is all you need.
Browsing Rules — Custom
Switch to the Custom sub-tab to see rules your team has authored. From here, the + Add Rule button in the top right opens the creation modal.
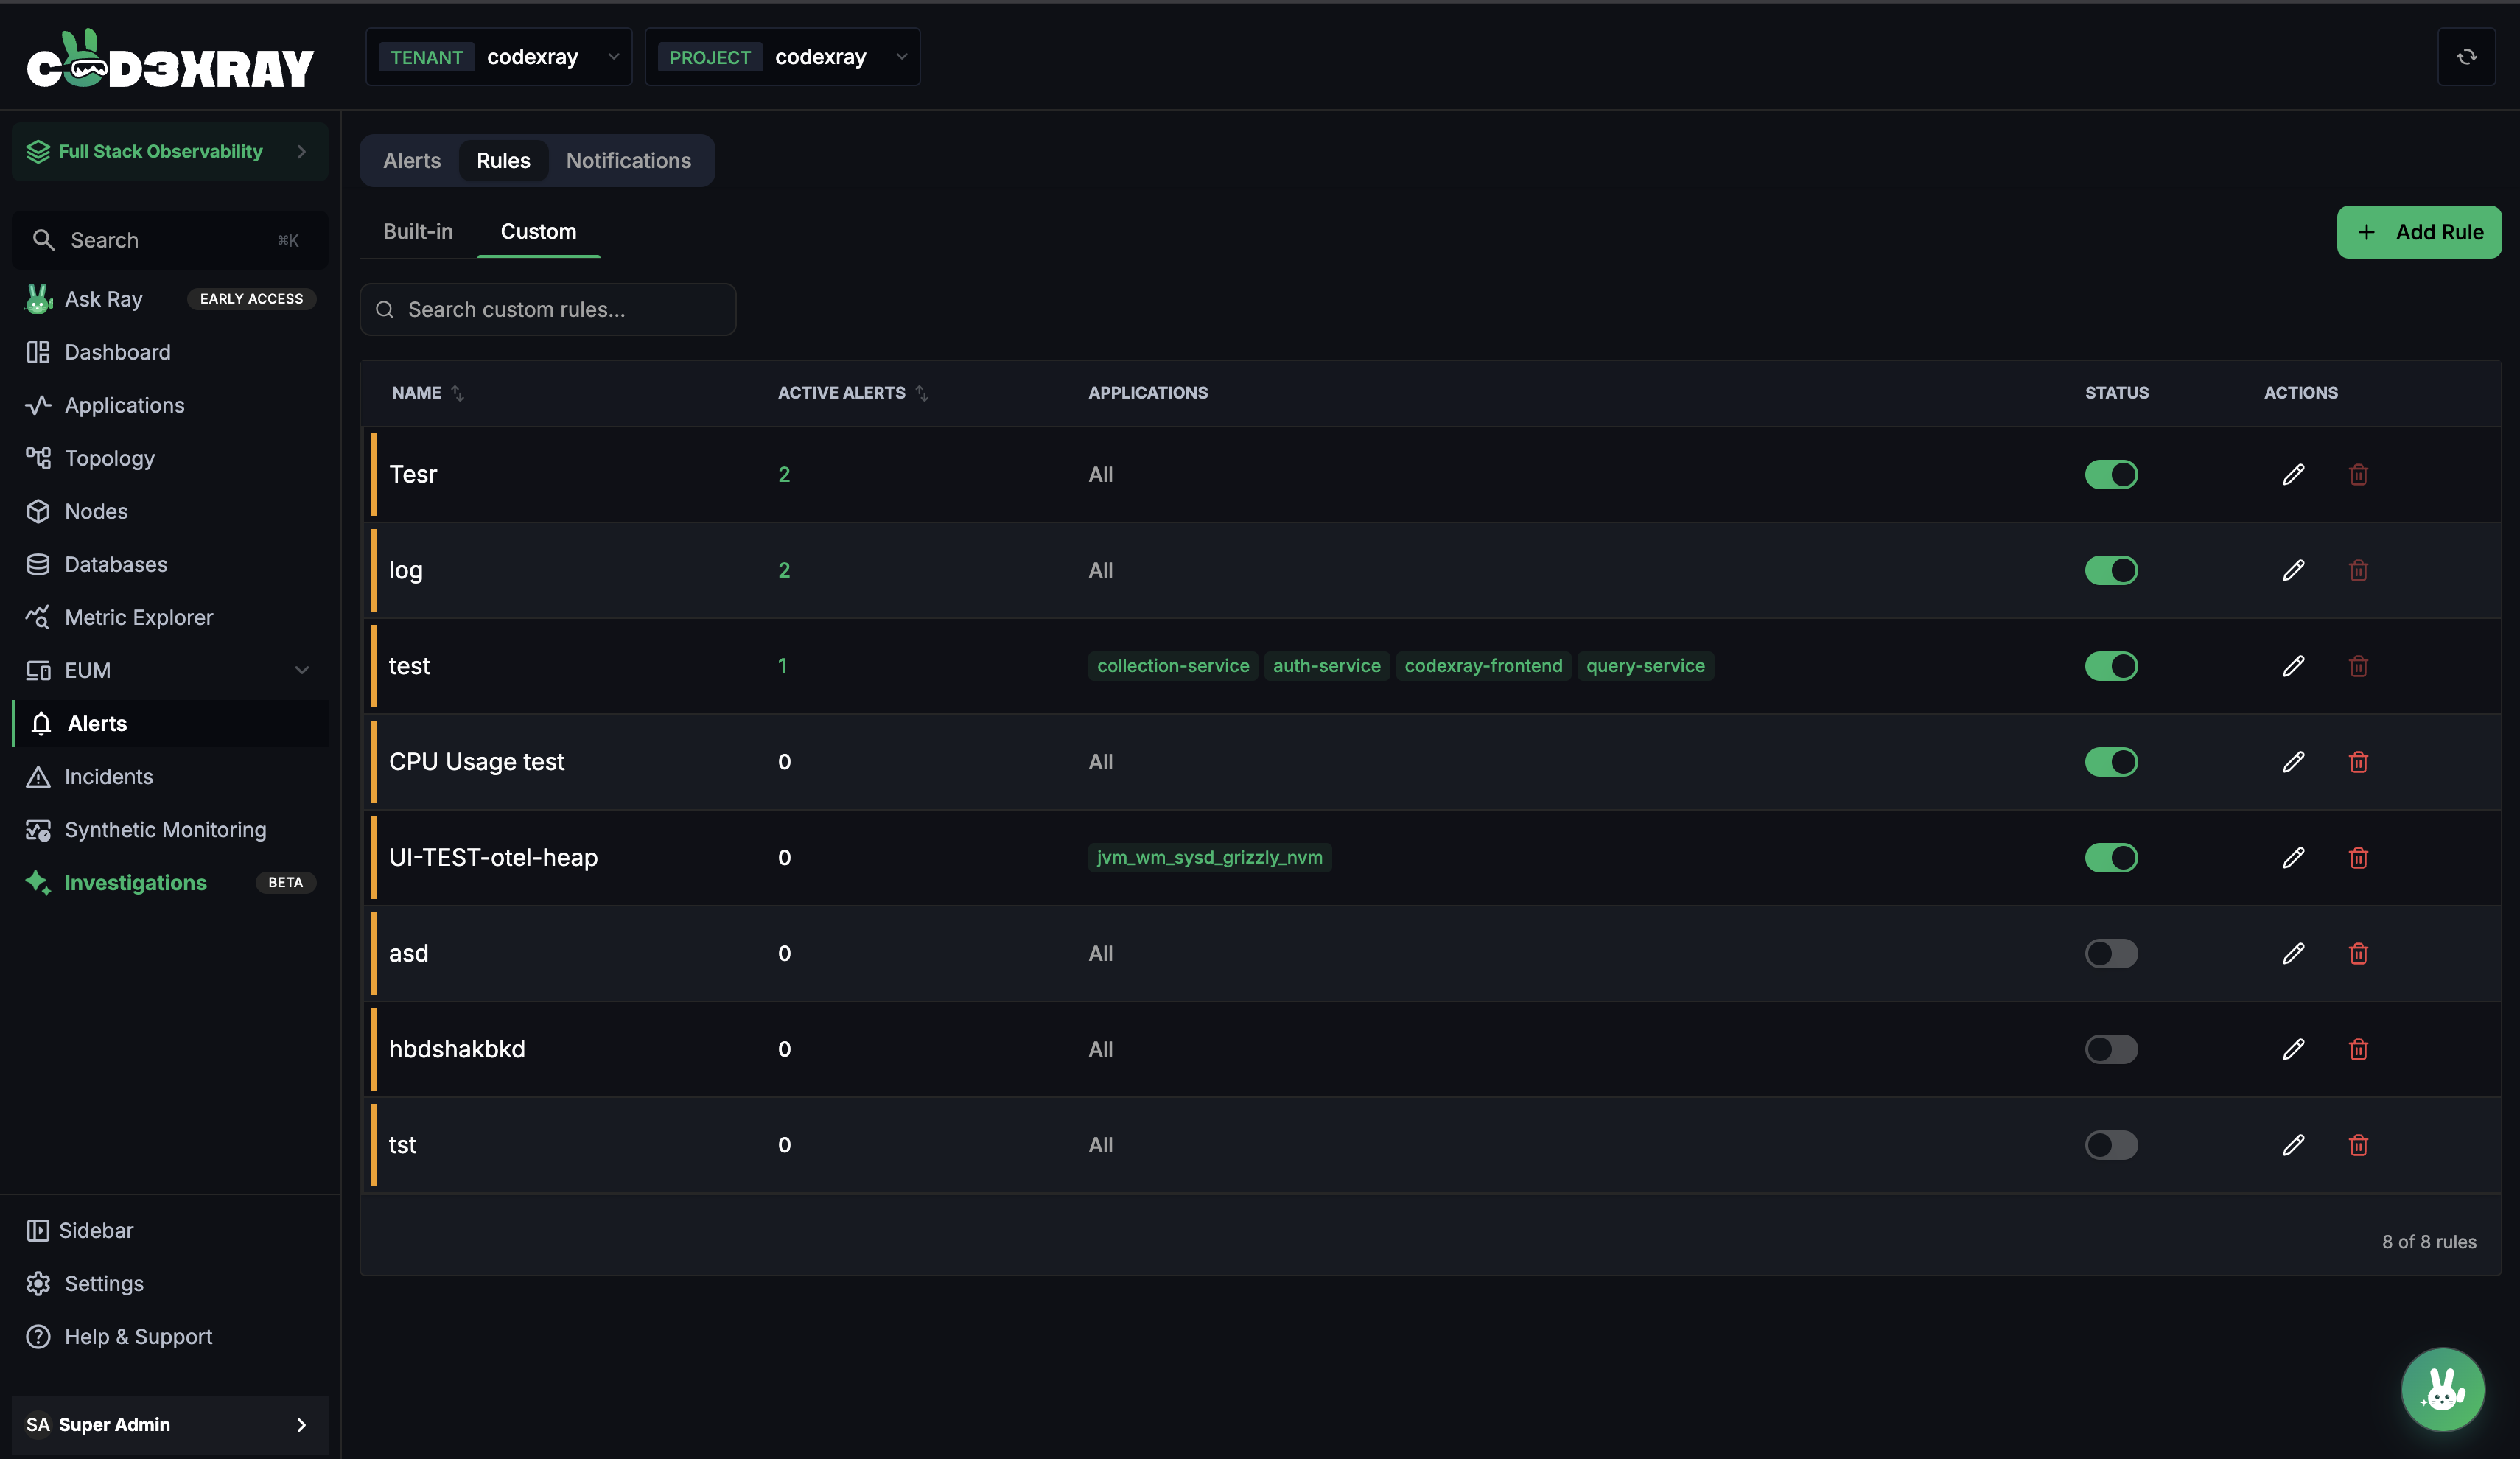
The Custom view shares the same columns as Built-in, with one addition in Actions:
- Status toggles a custom rule on/off straight from the list, the same as Built-in.
- Actions has both a pencil (edit) and a trash (delete) — custom rules can be removed; built-ins can't.
- Active Alerts still tracks live fires in real time, so you can spot a noisy rule the moment it's deployed.
Creating a Rule — The Three Modes
Click + Add Rule and the Create Alerting Rule modal opens. The most important field here is Data Source — it's the dropdown that picks which of the three creation modes you're using.
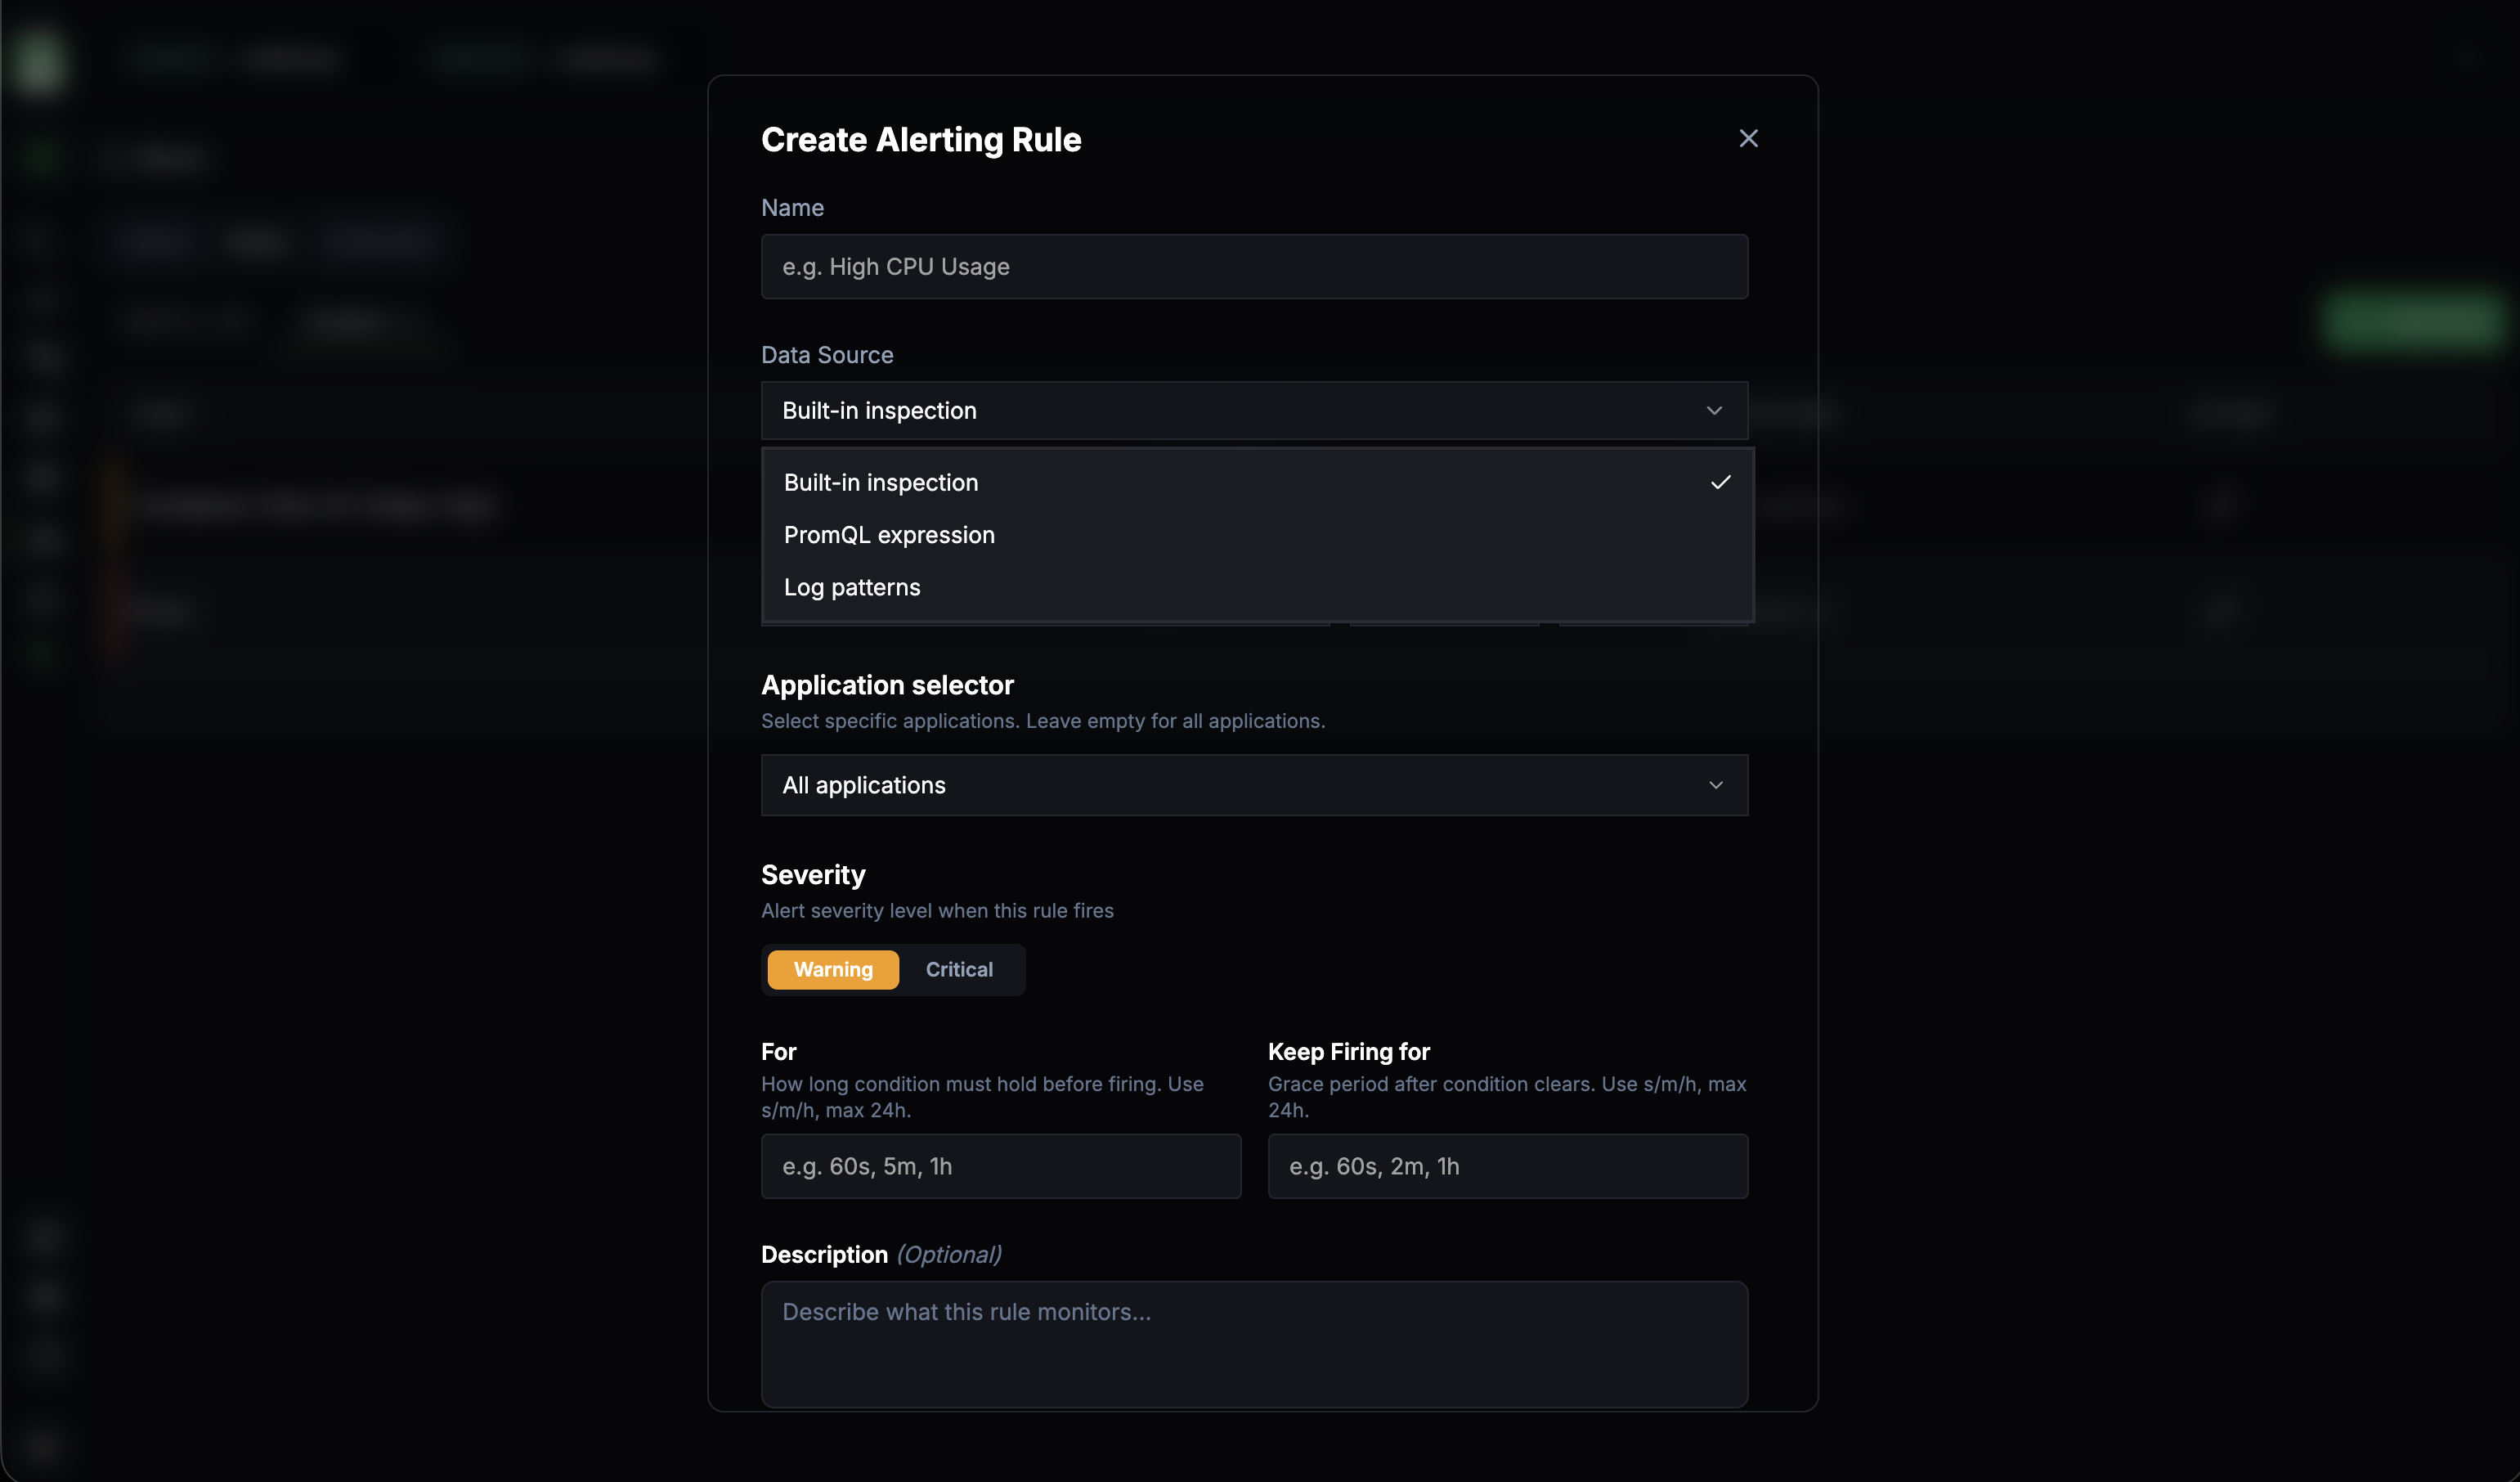
| Data Source | When to pick it | What changes in the form |
|---|---|---|
| Built-in inspection | You want one of the 25 shipped checks, but with different bounds or scope | An inspection picker replaces the query box — pick the inspection ID and the rule inherits its logic |
| PromQL expression | You need a derived metric, a rate, a percentile, or anything multi-metric | Query textarea + operator + threshold inputs appear |
| Log patterns | The signal lives in your logs, not your metrics | Pattern (substring) + log-level multi-select + minimum count appear |
The rest of the form is identical across all three modes:
- Name — display name, ≤ 30 chars, unique per project
- Application selector —
All applicationsor pick specific ones to scope the rule - Severity —
WarningorCritical - For — how long the condition must hold before firing (e.g.
5m,60s, max24h) - Keep Firing for — grace period after the condition clears
- Description (optional) — free text shown in the rule listing
Hit Create and the rule starts evaluating immediately on the next cycle.
Don't reach for PromQL when a built-in already covers the check — wrapping is faster, stays consistent with the dashboard, and benefits from any future inspection improvements. PromQL is for derived metrics; log patterns are for signals that never make it into a metric.
Configuring Notification Channels
Switch to the Notifications tab to manage where alerts get sent. Click + Create Channel for a new one, or View Details / the pencil on a card to edit an existing one — both open the same modal.
A notification channel is a named group of integrations. Rather than one channel equalling one destination, you name the channel and then switch on any mix of Slack, PagerDuty, Webhook, and Microsoft Teams inside it — each routed and configured independently. That's why a single channel (like the built-in Default) can post to Slack, PagerDuty, Webhook, and MS Teams at once.
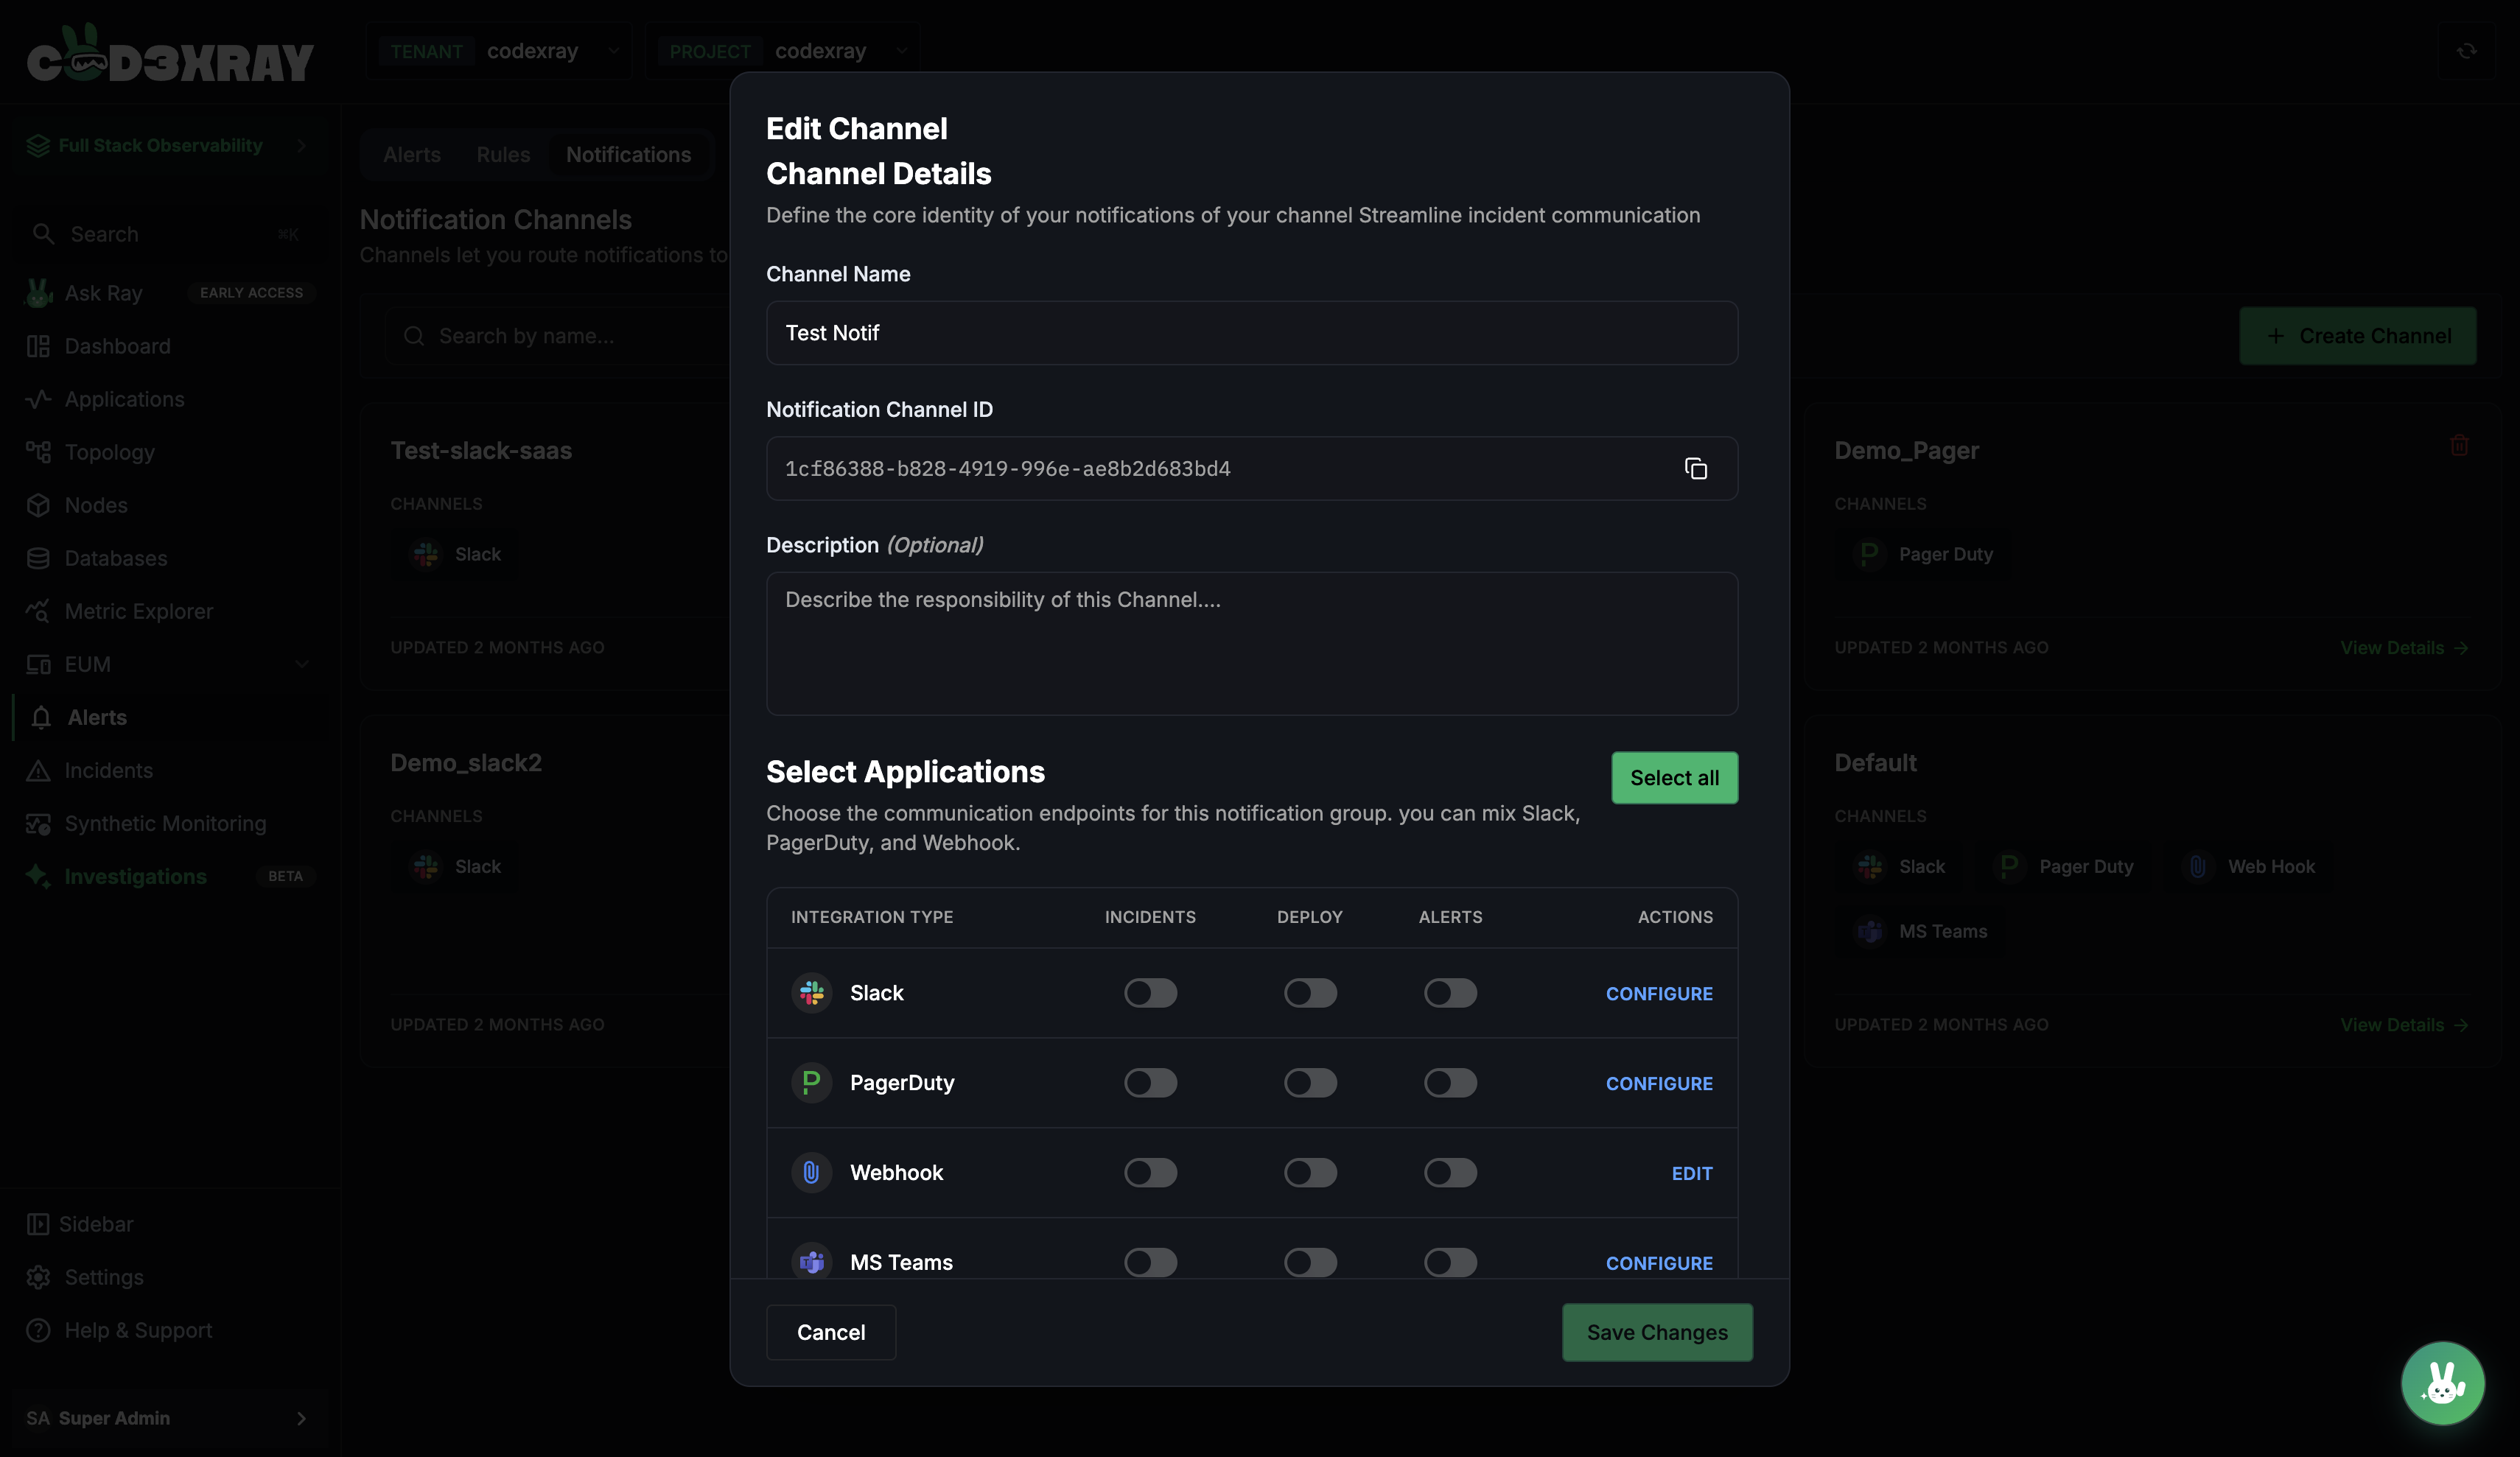
Channel details
- Channel Name — how the channel shows up in the list and in a rule's channel picker.
- Notification Channel ID — the channel's unique ID, with a copy button. This is the value a rule references to route its alerts here.
- Description (optional) — a note on what the channel is responsible for.
Integrations
The heart of the modal is the integrations table. Each row is one destination — Slack, PagerDuty, Webhook, Microsoft Teams — with three independent toggles and a Configure action:
| Column | What it controls |
|---|---|
| Incidents | Send SLO-based incident events (open / resolve / severity change) to this integration |
| Deploy | Send deployment events for tracked applications |
| Alerts | Send rule-based alert firings and resolutions |
| Configure / Edit | Open that integration's connection settings |
Turn on only the event types each destination should receive — e.g. Slack on Alerts + Deploy, PagerDuty on Alerts only. A destination left with all three toggles off stays part of the channel but silent.
Configure each integration
Click Configure on a row to enter that integration's credentials:
- Slack — Bot Token and the default channel (e.g.
#test-qa). - Microsoft Teams — the channel's incoming-webhook URL (see below).
- Webhook — the endpoint URL, plus any custom headers (e.g. an auth header).
- PagerDuty — the Integration Key from the PagerDuty service.
Hit Save Changes. A rule reaches this channel once you attach it in the rule's channel selector — a rule with no channel attached notifies no one.
Connecting Microsoft Teams
MS Teams needs just one value — an Incoming Webhook URL for the channel you want alerts to land in. You create that on the Teams side, then paste it into the integration's Configure dialog:
- In Microsoft Teams, open the target channel and choose More options (•••) → Connectors (or Manage channel → Connectors).
- Find Incoming Webhook and click Configure (or Add).
- Give it a name (e.g.
CodeXray Alerts), optionally upload an icon, and click Create. - Copy the webhook URL Teams generates — this is the only credential CodeXray needs.
- Back in CodeXray, open (or create) a notification channel, switch on the MS Teams row, click Configure, paste the URL, and Save Changes.
Each alert then arrives in that Teams channel as a card showing the project, rule, value, status, severity, and a View Alert in CodeXray link. Teams cards can't be threaded or edited, so a fire, each reminder, and the resolution each post as their own card.
The webhook URL is bound to the single Teams channel you created it in — all alerts routed through this integration post there. To reach different Teams channels, create an Incoming Webhook in each and configure the MS Teams integration on a separate notification channel for each URL.
Investigating a Fired Alert
When a rule fires, it appears in the Alerts tab (currently firing) and, when it resolves, moves to history. Clicking any alert opens the detail drawer.
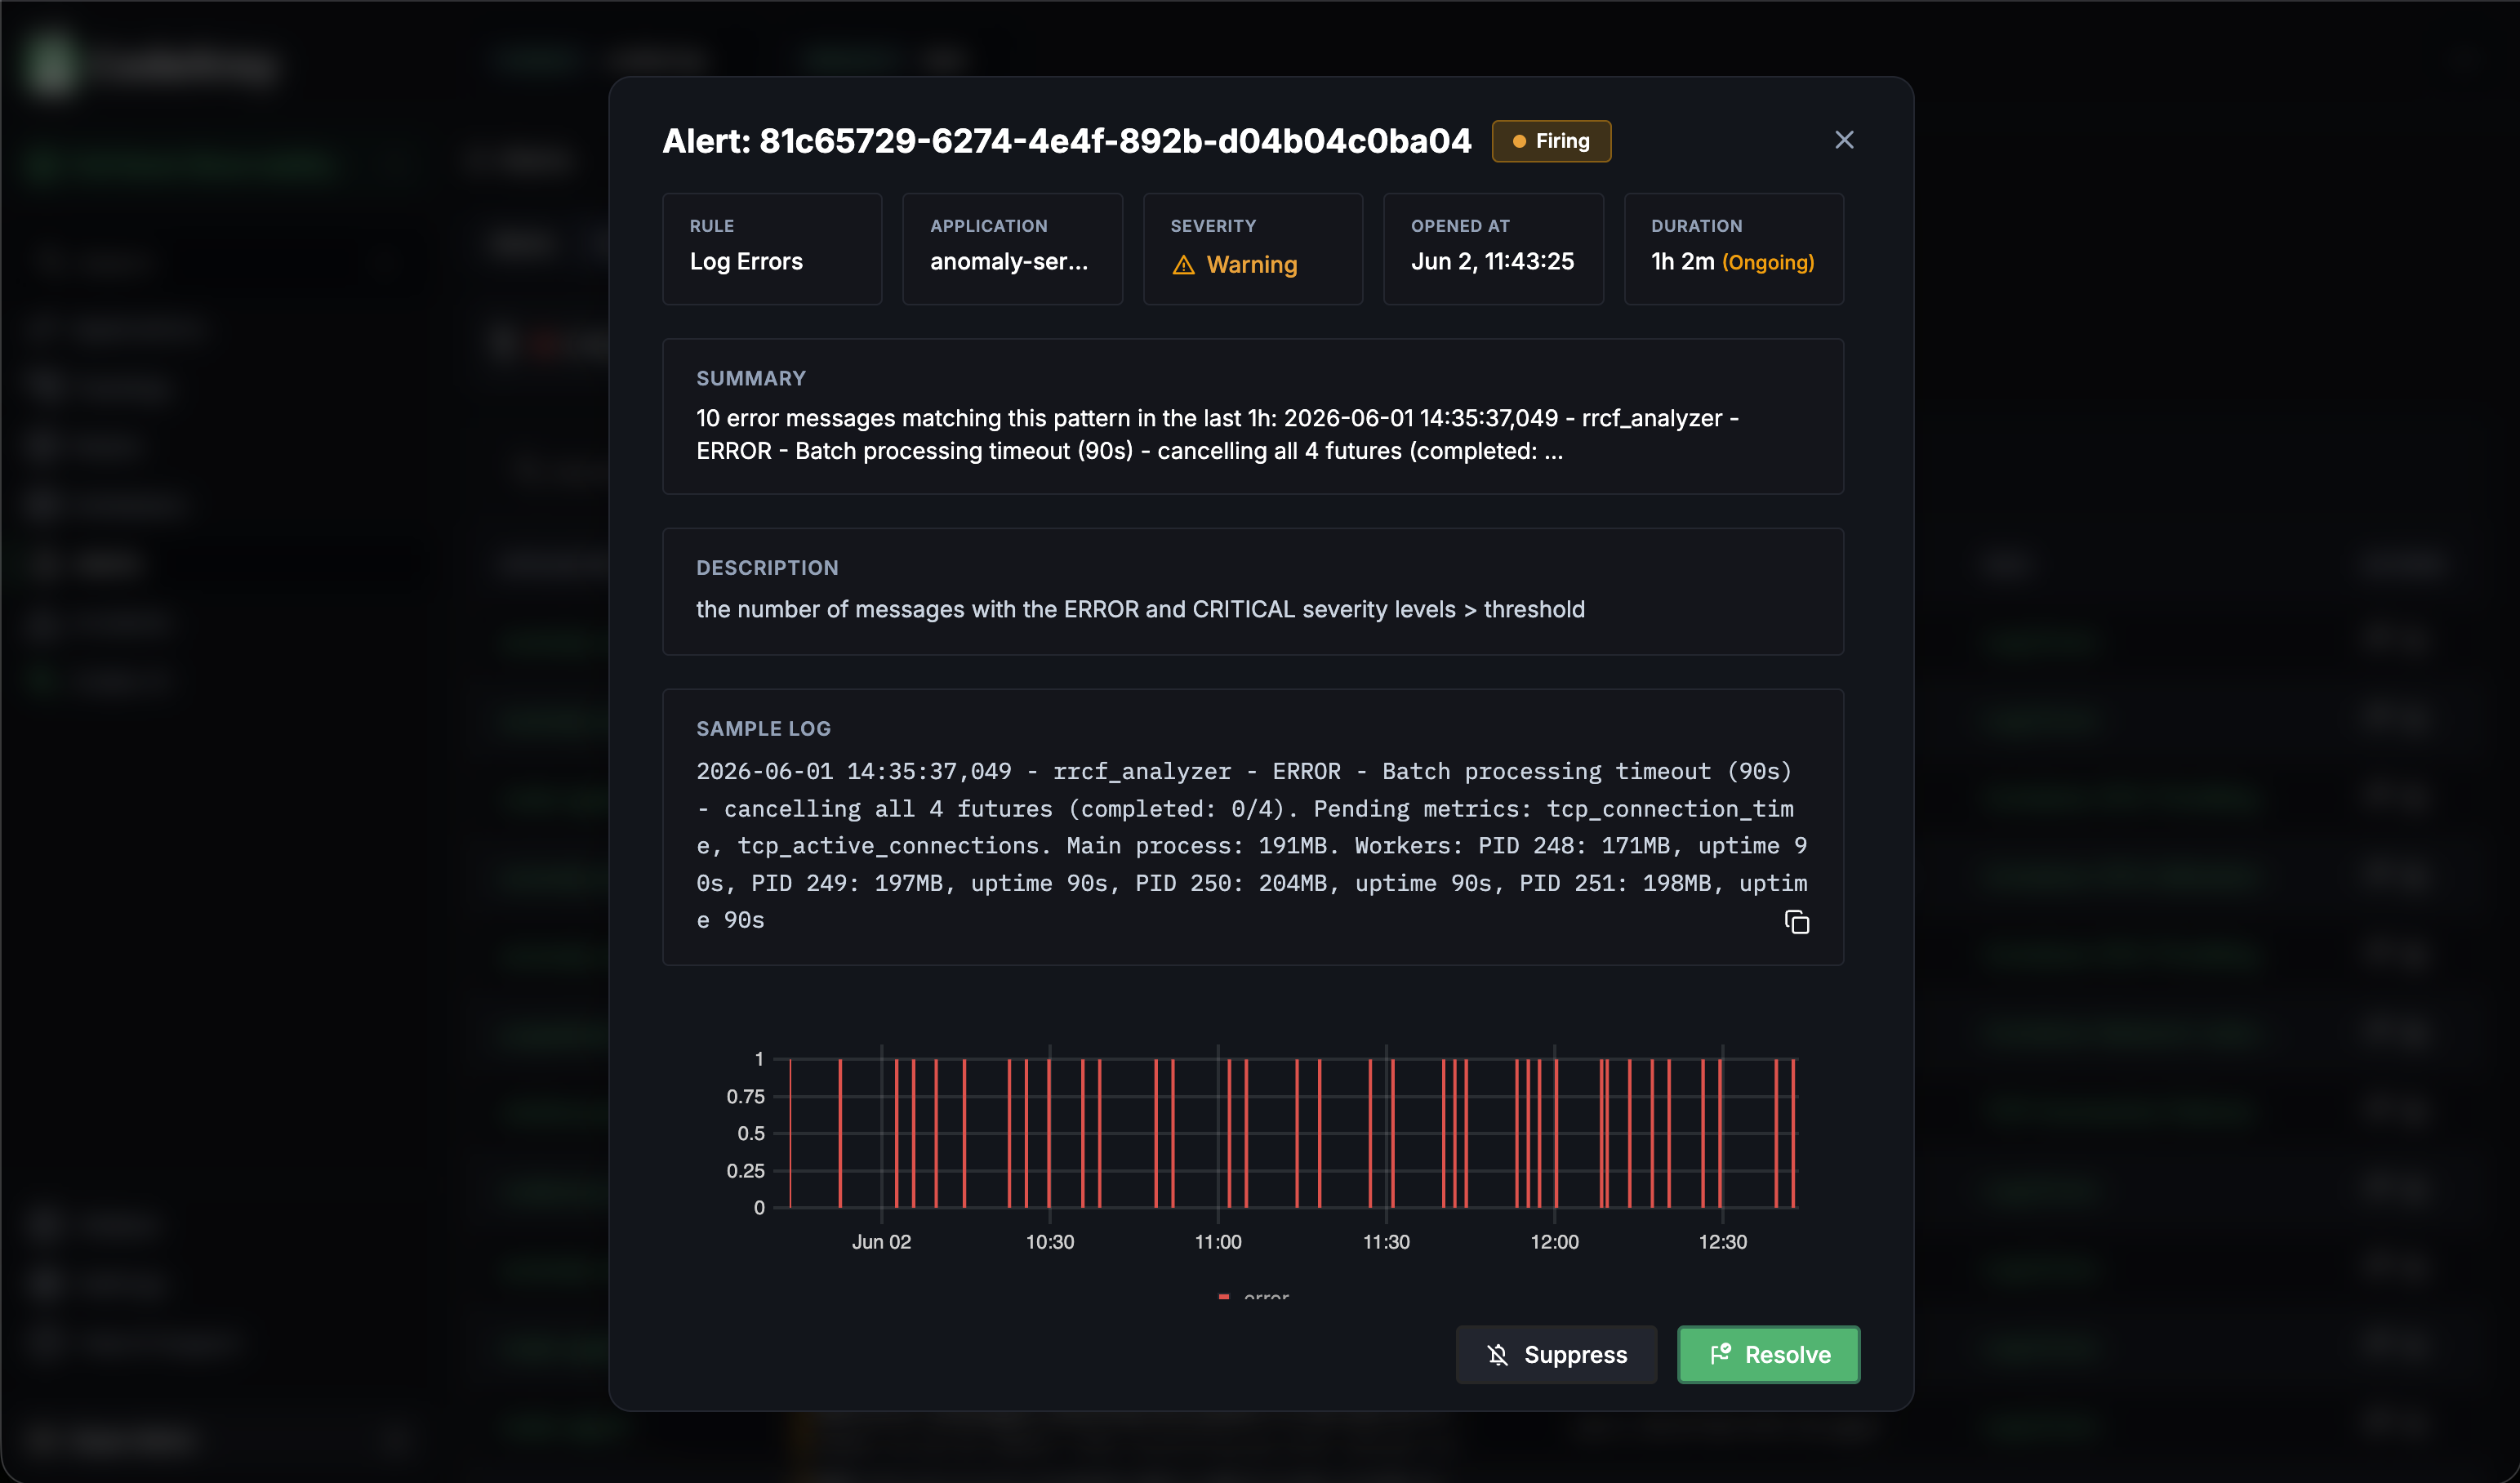
The drawer is built to answer "is this real, and what do I do about it?" without leaving the page:
| Section | What it tells you |
|---|---|
| Header | Alert UUID, the firing badge, and the close action |
| Rule · Application · Severity · Opened at · Duration | The five things you want to know in the first two seconds |
| Summary | The rendered notification body — what was sent to your channels, with {value} / {count} / {bytes} filled in. If the rule has RCA on fire enabled, the AI root-cause write-up appears here too, added a few moments after the alert opens |
| Description | The plain-text description from the rule definition |
| Sample Log (log-pattern rules) | One real log line matching the pattern — confirms the rule fired on the message you expected |
| Frequency chart | A timeline of every fire/resolve for this rule, so you can immediately see whether this is a one-off or a recurring pain point |
| Suppress · Resolve | Manual controls — Suppress quietens the rule for a window, Resolve marks the alert closed without waiting for the condition to clear |
If a rule is correctly firing but you don't want to be pinged again during an ongoing incident, Suppress is the right tool — it pauses notifications for a window without disabling the rule, so it'll naturally resolve when the underlying condition clears. Disable is for rules that are misconfigured or no longer relevant.
Putting It Together — A Typical First-Day Flow
A common path through the module for a team setting up alerts on a new project:
- Open Rules → Built-in. Scan the 25 defaults. Decide which ones are noisy (low severity, common in your environment) — disable them or drop them to
info. - Open Notifications. Create a channel, switch on the integrations you want (Slack or Microsoft Teams for team chat, PagerDuty for paging, optionally a Webhook for your own incident system), and toggle Alerts on for each. Configure each integration's credentials.
- Back to Rules → Built-in. Open the four or five rules you actually want to be paged on (typically
instance_availability,memory_oom,slo_burn_rate_fast,log_errors). Attach the PagerDuty channel and bump severity tocriticalif needed. - Add a couple of Custom rules for the service-specific signals (a known error log pattern, a business-metric PromQL).
- Watch the Alerts tab for a day. Tune
fordurations on anything flappy.
Next Steps
- Alerts — Overview — the concepts, the rule anatomy, and the bulk API for managing rules at scale
- Log Monitoring — pattern extraction, which is what powers log-pattern alert rules
- Architecture — where the alert engine sits in the full CodeXray data pipeline