Managing Dashboards
This page covers everything outside the widget editor — the list view, creating and organising dashboards, the view-vs-edit toggle, drag-resize layout, and the bulk JSON import flow. For the widget editor itself, jump to Building Widgets.
A dashboard has two modes — View (read-only, what your team sees on a screen) and Edit (drag, resize, add, delete, paste JSON). The toggle is one button. There's no "publish" step — saving from Edit mode immediately updates what View mode shows.
The List View
Open Dashboards from the left nav and you land on the project's full inventory. Every dashboard scoped to your active tenant + project appears here.
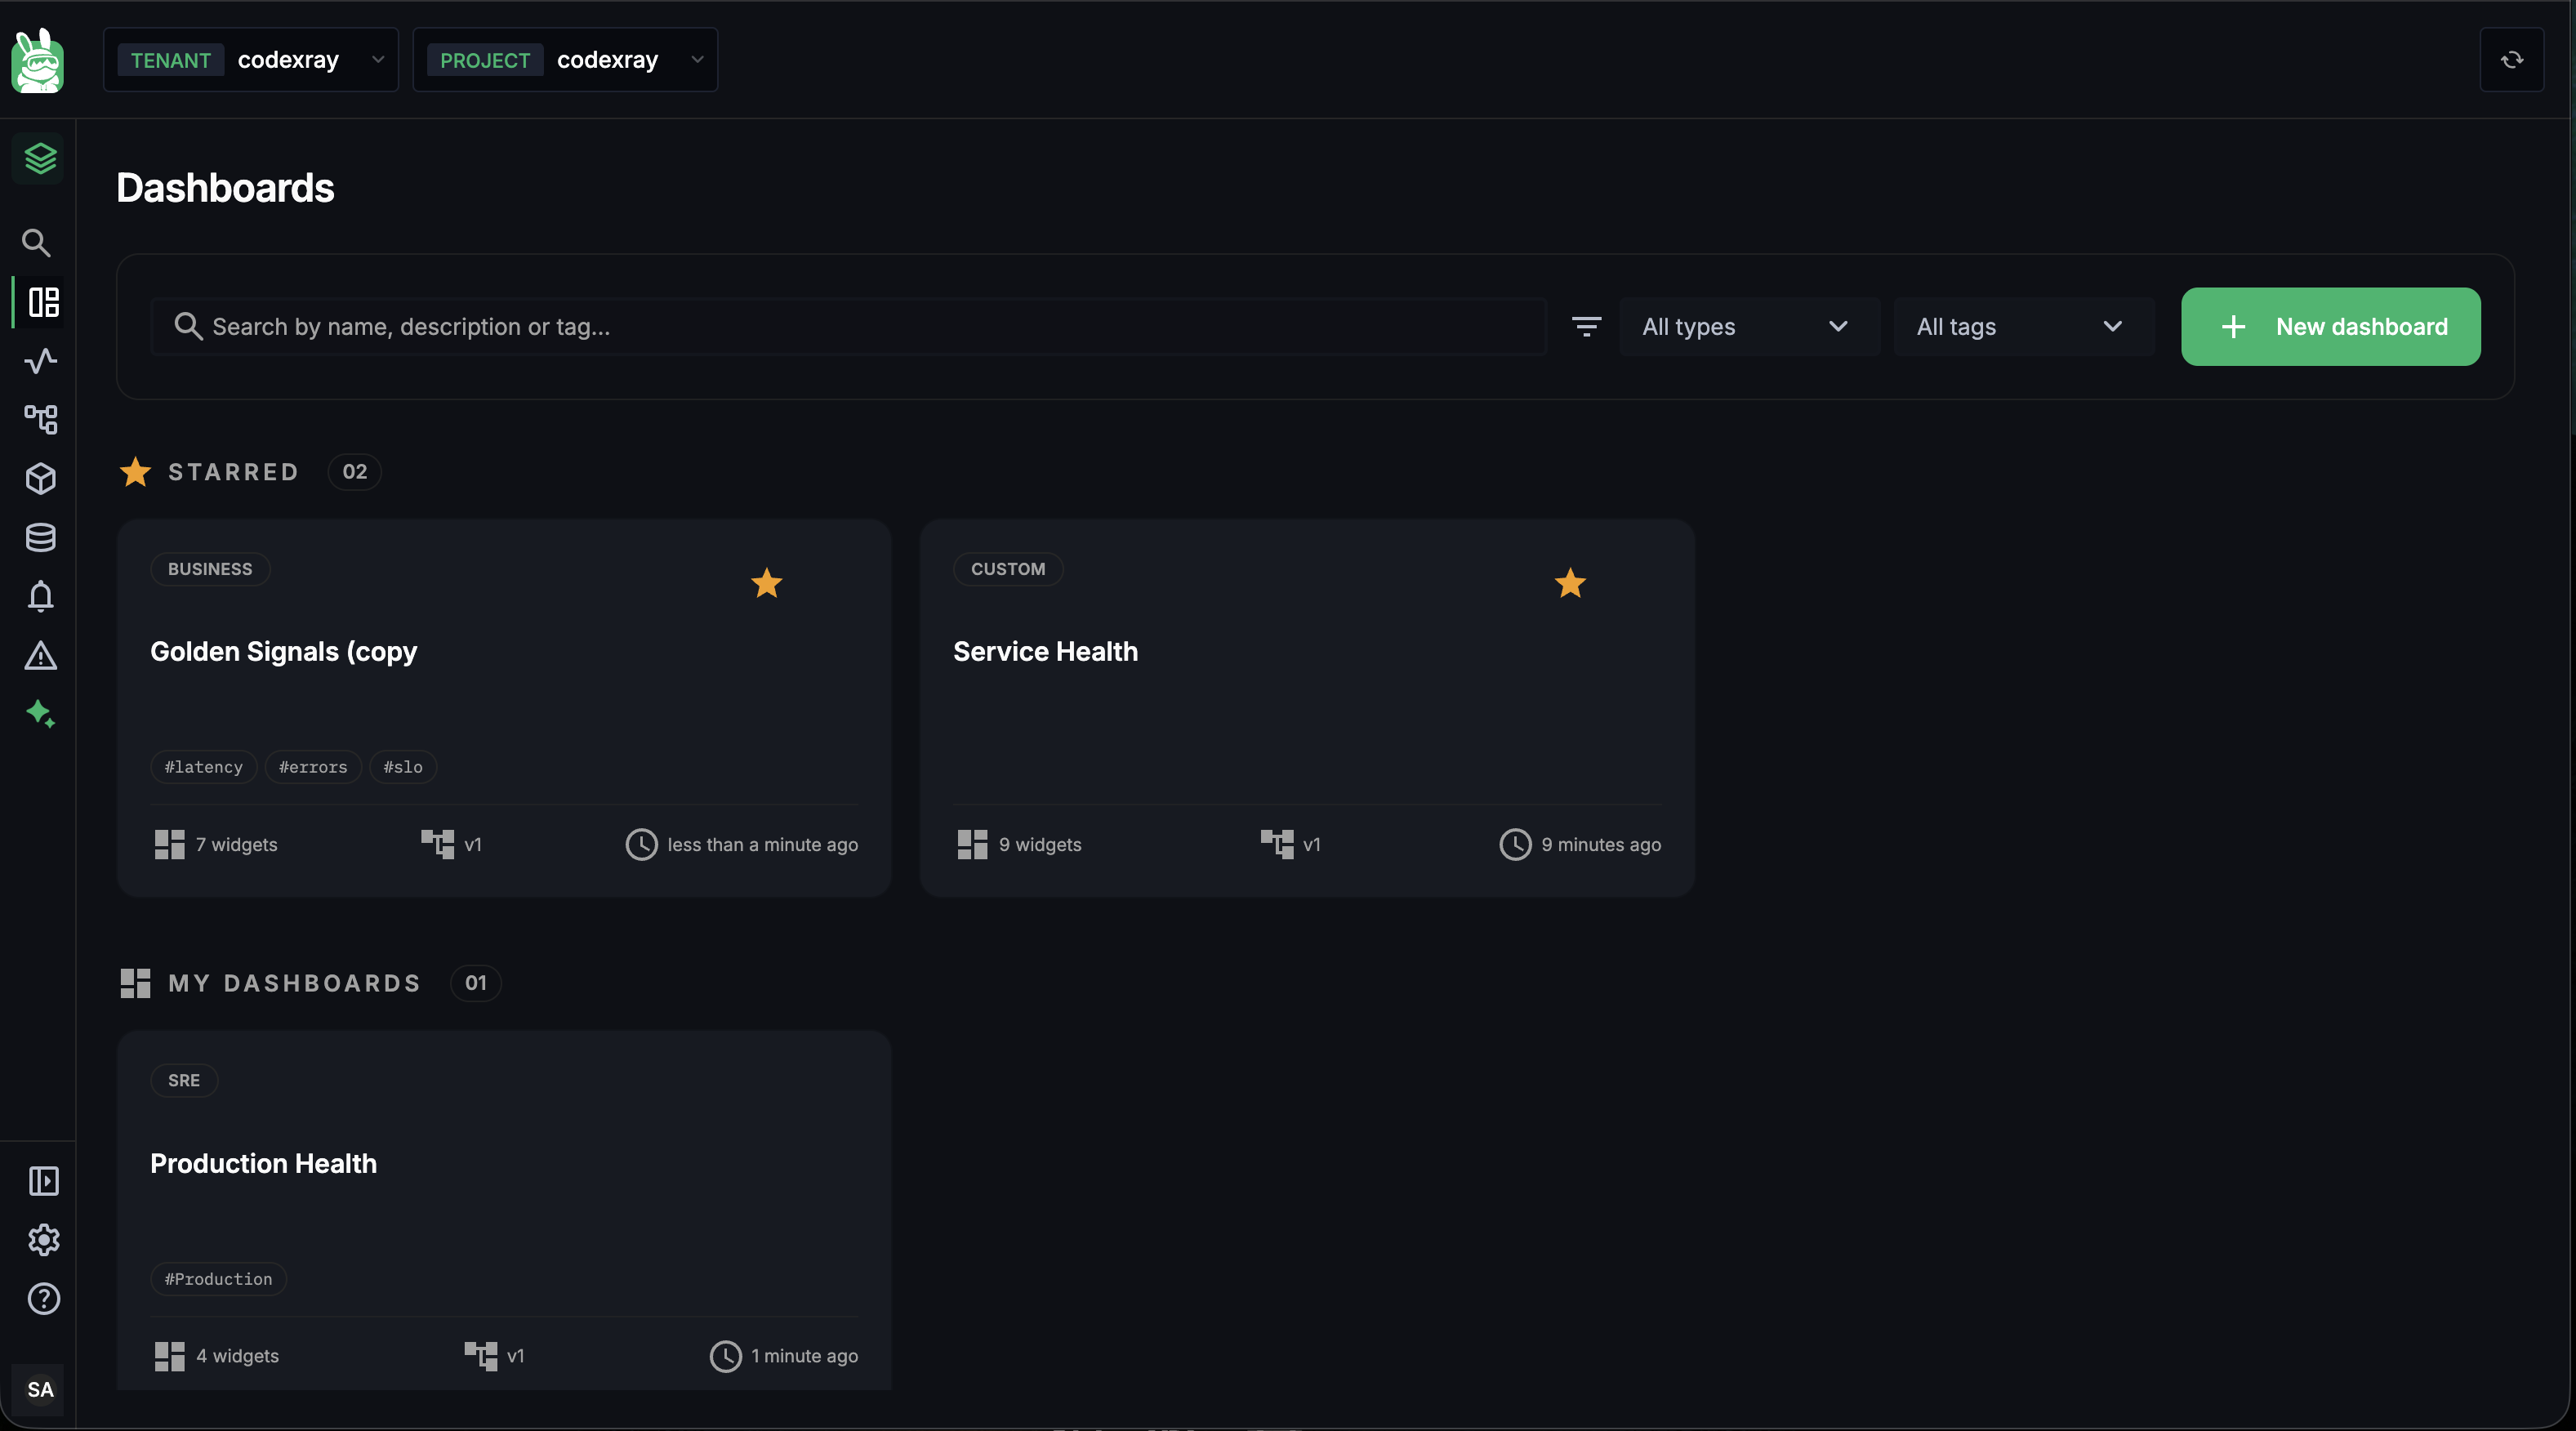
Anatomy of a card
Each dashboard is one card. Cards carry:
| Field | What it tells you |
|---|---|
| Type badge | CUSTOM · BUSINESS · SRE · SERVICE · INFRASTRUCTURE · SECURITY — set at creation, drives the type filter |
| Title | The dashboard name (1–50 chars) |
| Star icon (top-right) | Click to toggle. Starred dashboards float to the top in the Starred section. |
| Tags | Up to 20 free-text tags (e.g. #latency, #prod, #payments). Drives the tag filter. |
| Widget count | How many panels live inside |
Version badge (v1) | The dashboard's current version — bumps on each save. On the dashboard's view page it opens Version History |
| Updated ago | Relative time since the last save |
Click the title to open the dashboard.
The Starred / My Dashboards split
The list is partitioned into two sections:
- STARRED — every dashboard you've starred, sorted by most recently updated. Pin the boards your team lives in here.
- MY DASHBOARDS — everything else, sorted by most recently updated.
The split is per-user — your stars don't affect what your teammates see at the top.
Filters and search
The bar above the list has three controls:
| Control | Filters on |
|---|---|
| Search | Name, description, or tag. Substring, case-insensitive. |
| All types | The type badge (Custom · Business · SRE · …) |
| All tags | Any tag attached to any dashboard in the project |
Filter state is synced to the URL — you can bookmark or share a filtered view. Clearing the search bar restores the full list.
Creating a Dashboard
Click + New dashboard in the top-right and the create dialog opens.
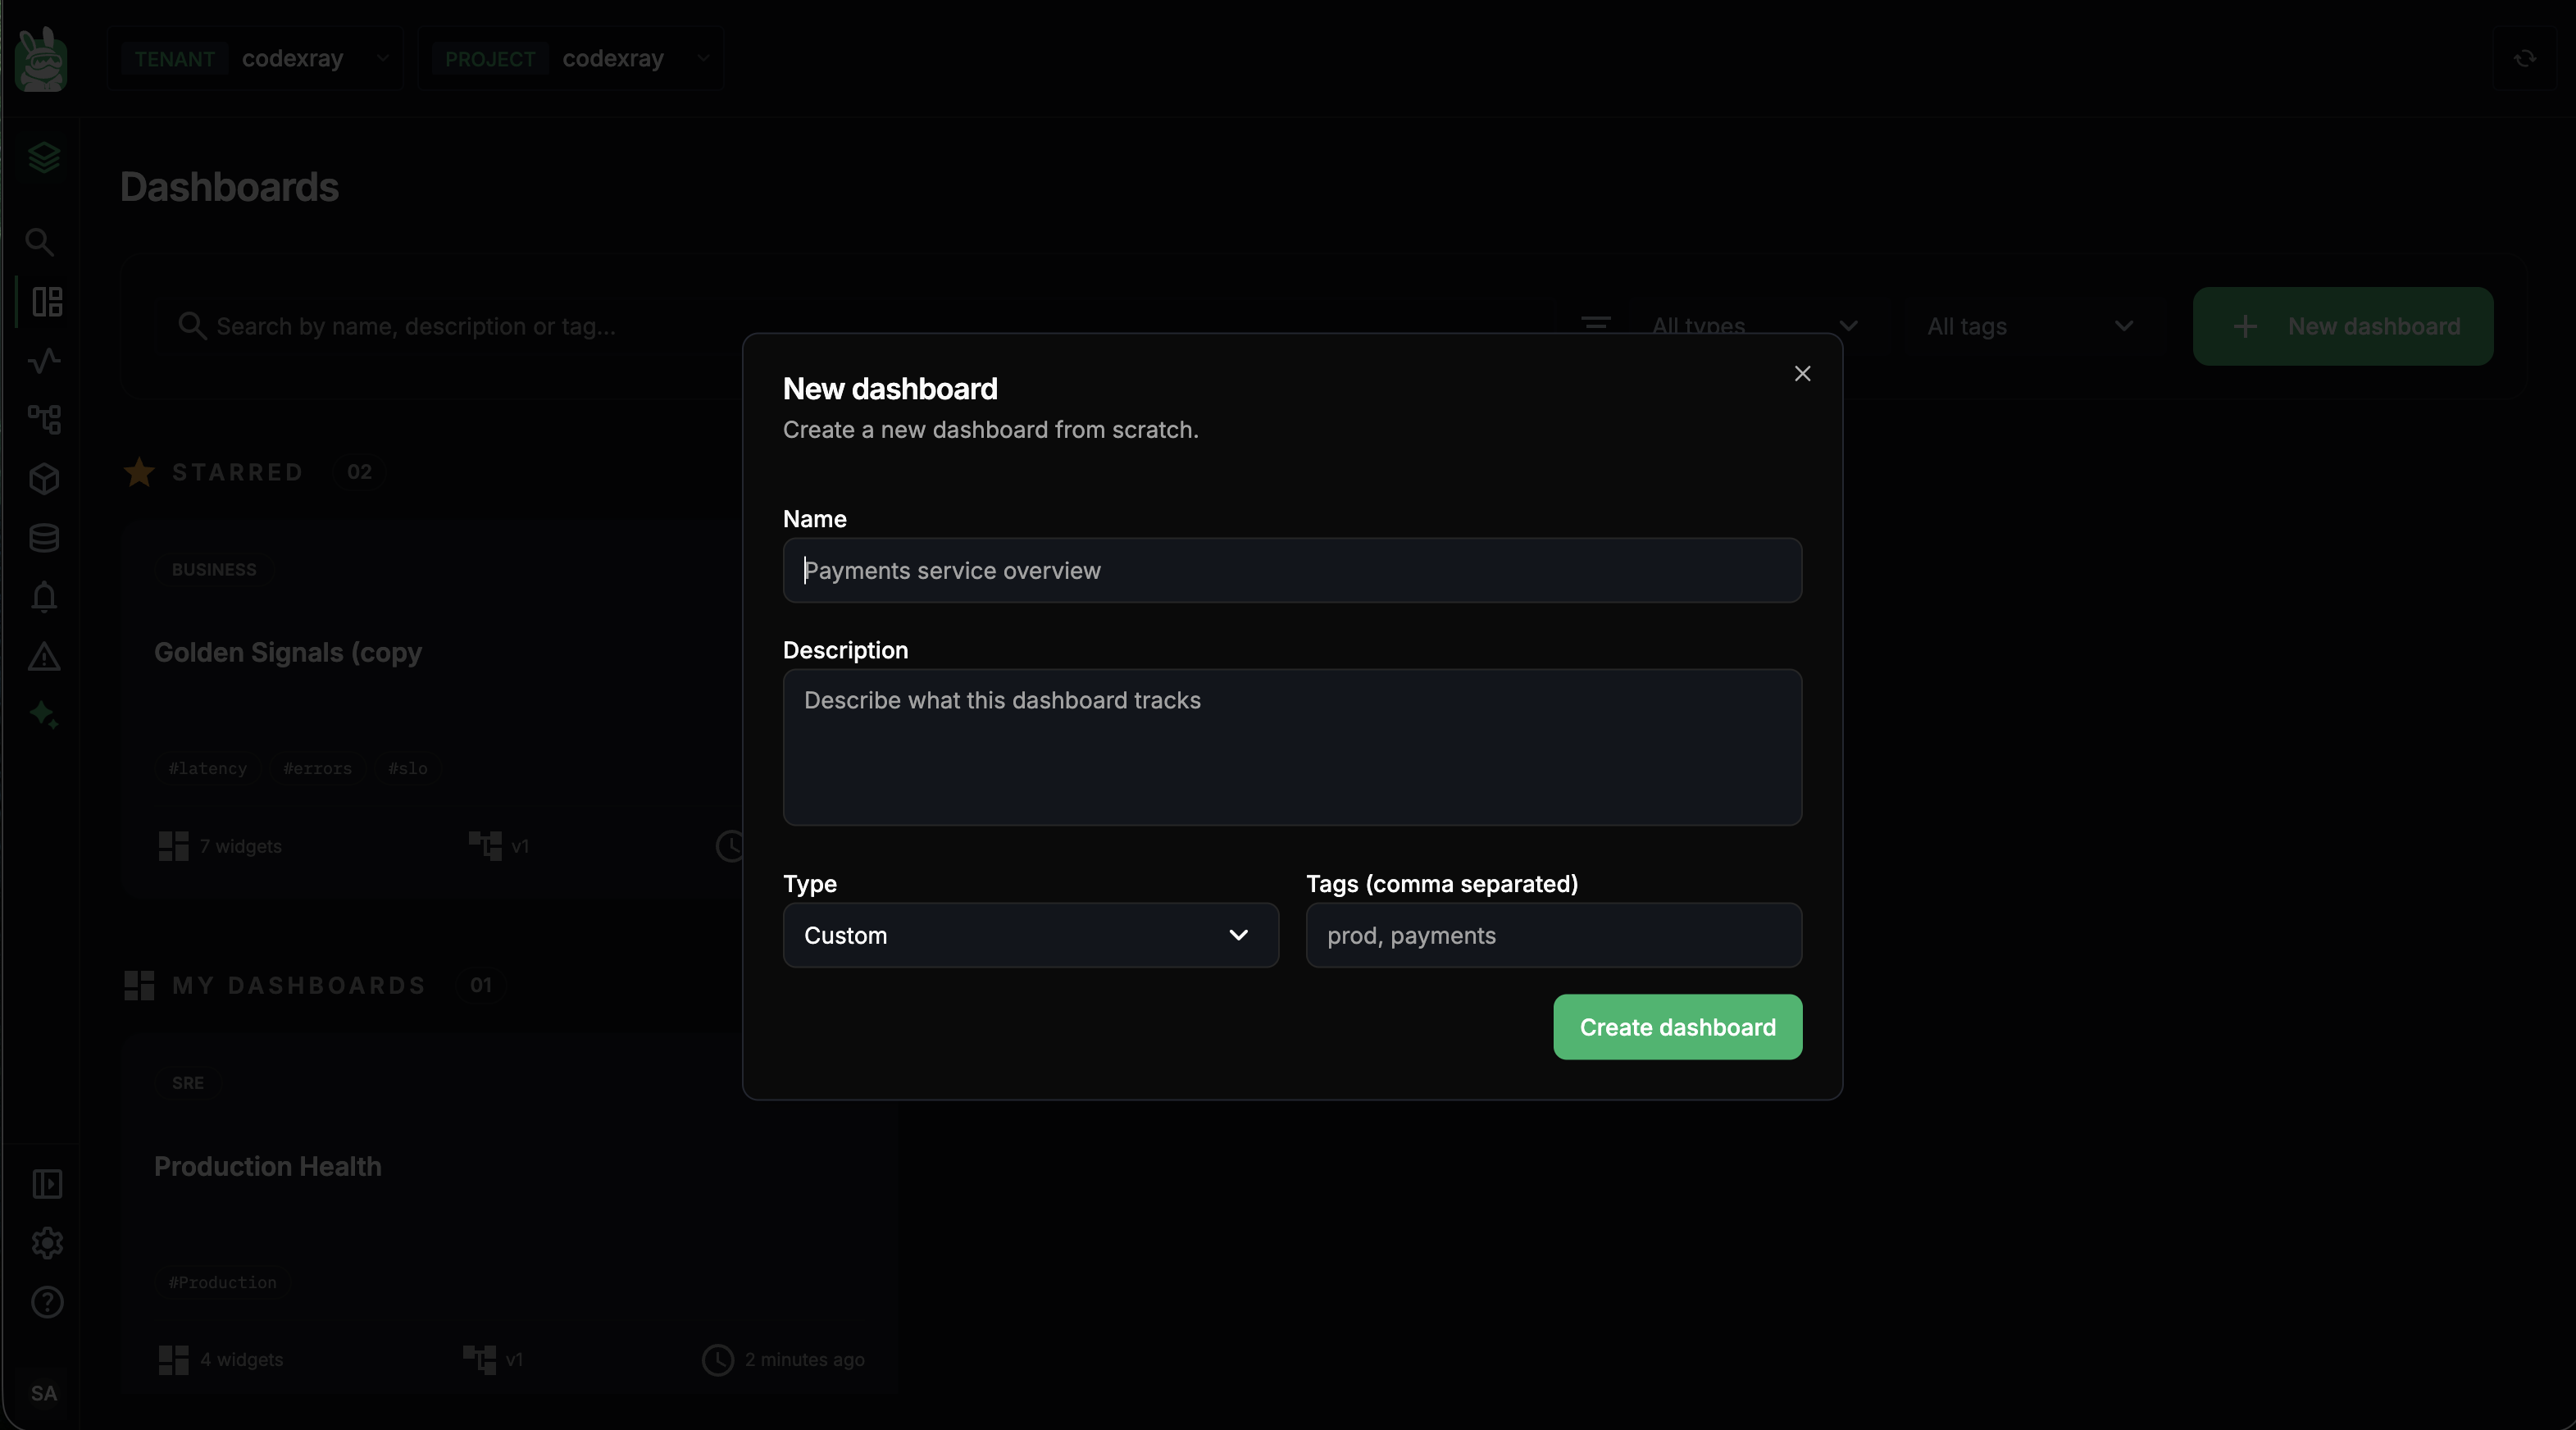
| Field | Required | Notes |
|---|---|---|
| Name | ✓ | 1–50 chars. Must match ^[A-Za-z0-9 _.,:();\-]+$ — letters, digits, spaces, and _ . , : ( ) ; -. No special symbols, no emoji. |
| Description | optional | Up to 300 chars. Shows on hover in the list view; helps your team understand what the board is for. |
| Type | ✓ | Defaults to Custom. Pick one of: Custom · Service · Infrastructure · Business · SRE · Security. The type is purely organisational — it drives the filter on the list view and the badge on the card. It does not change what the dashboard can do. |
| Tags (comma separated) | optional | Up to 20 tags. Each tag is 1–32 chars, alphanumeric and hyphen only ([A-Za-z0-9-]+). Tags drive the list view's tag filter, so name them in a way your team can discover. |
Tags are project-wide and free-text — without a convention they sprawl into noise. A pattern that works: one tag for environment (prod, staging), one for team or domain (payments, ingest), one for signal type (latency, errors, slo). Two or three tags per dashboard is usually enough.
Hit Create dashboard. You land on the new, empty dashboard in View mode with a "This dashboard has no widgets yet" prompt — click Edit to start adding panels.
View Mode
Click any dashboard from the list and you open in View mode — read-only, full-fidelity panels, no drag handles.
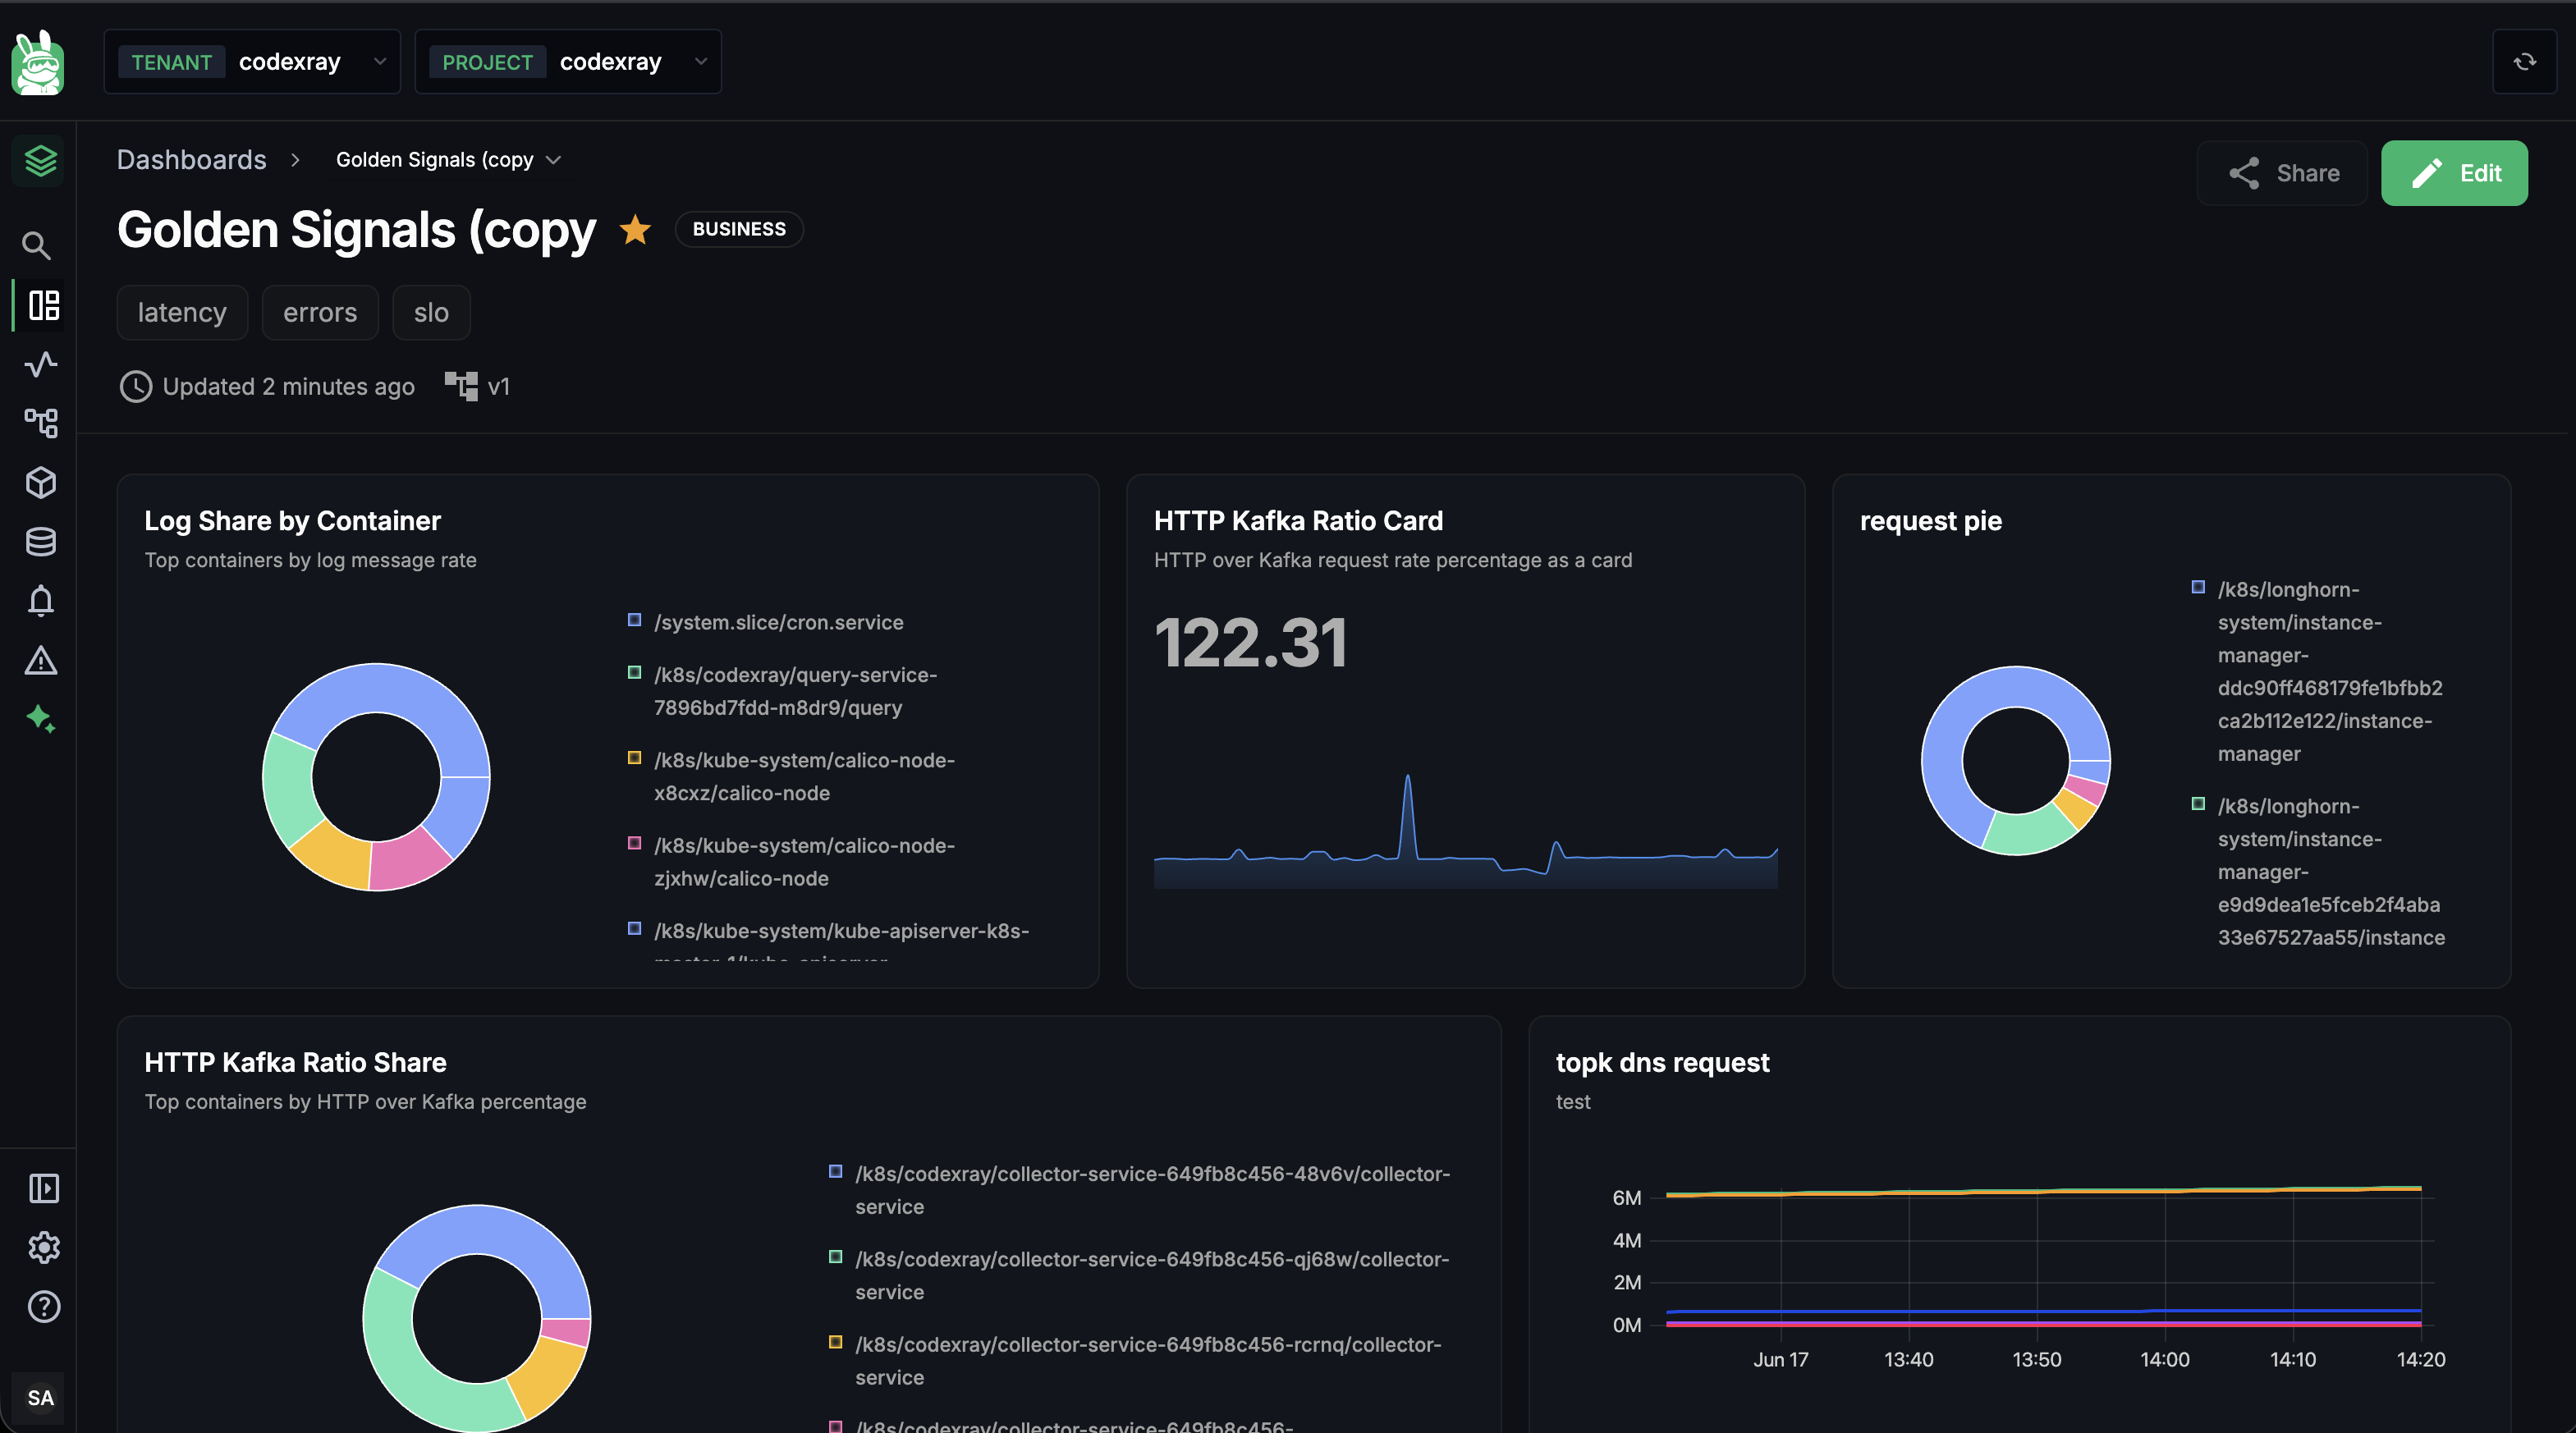
Header
The top bar carries everything you need to know about the dashboard before you read the panels:
- Breadcrumb —
Dashboards › <name>— clickDashboardsto go back to the list - Title with the star toggle and type badge inline
- Tag chips below the title
- Updated N minutes ago + the author's avatar + the version badge
- Share button (currently informational; the real sharing model is project-wide RBAC — see Role-Based Access Control)
- Edit button — top-right; flips to Edit mode
Reading the panels
Each panel shows what it's supposed to render right now — a number, a chart, a pie, a table. Widgets refresh on dashboard open and use the per-widget time preference baked into each one (see Per-widget time range). There's no dashboard-wide time picker — different panels can be on different windows on purpose.
Hover any panel and the kebab menu (⋮) in the top-right of the panel offers per-widget actions (currently used for edit / delete in Edit mode; reserved in View mode).
Edit Mode
Click Edit in the header and the dashboard reveals its grid.
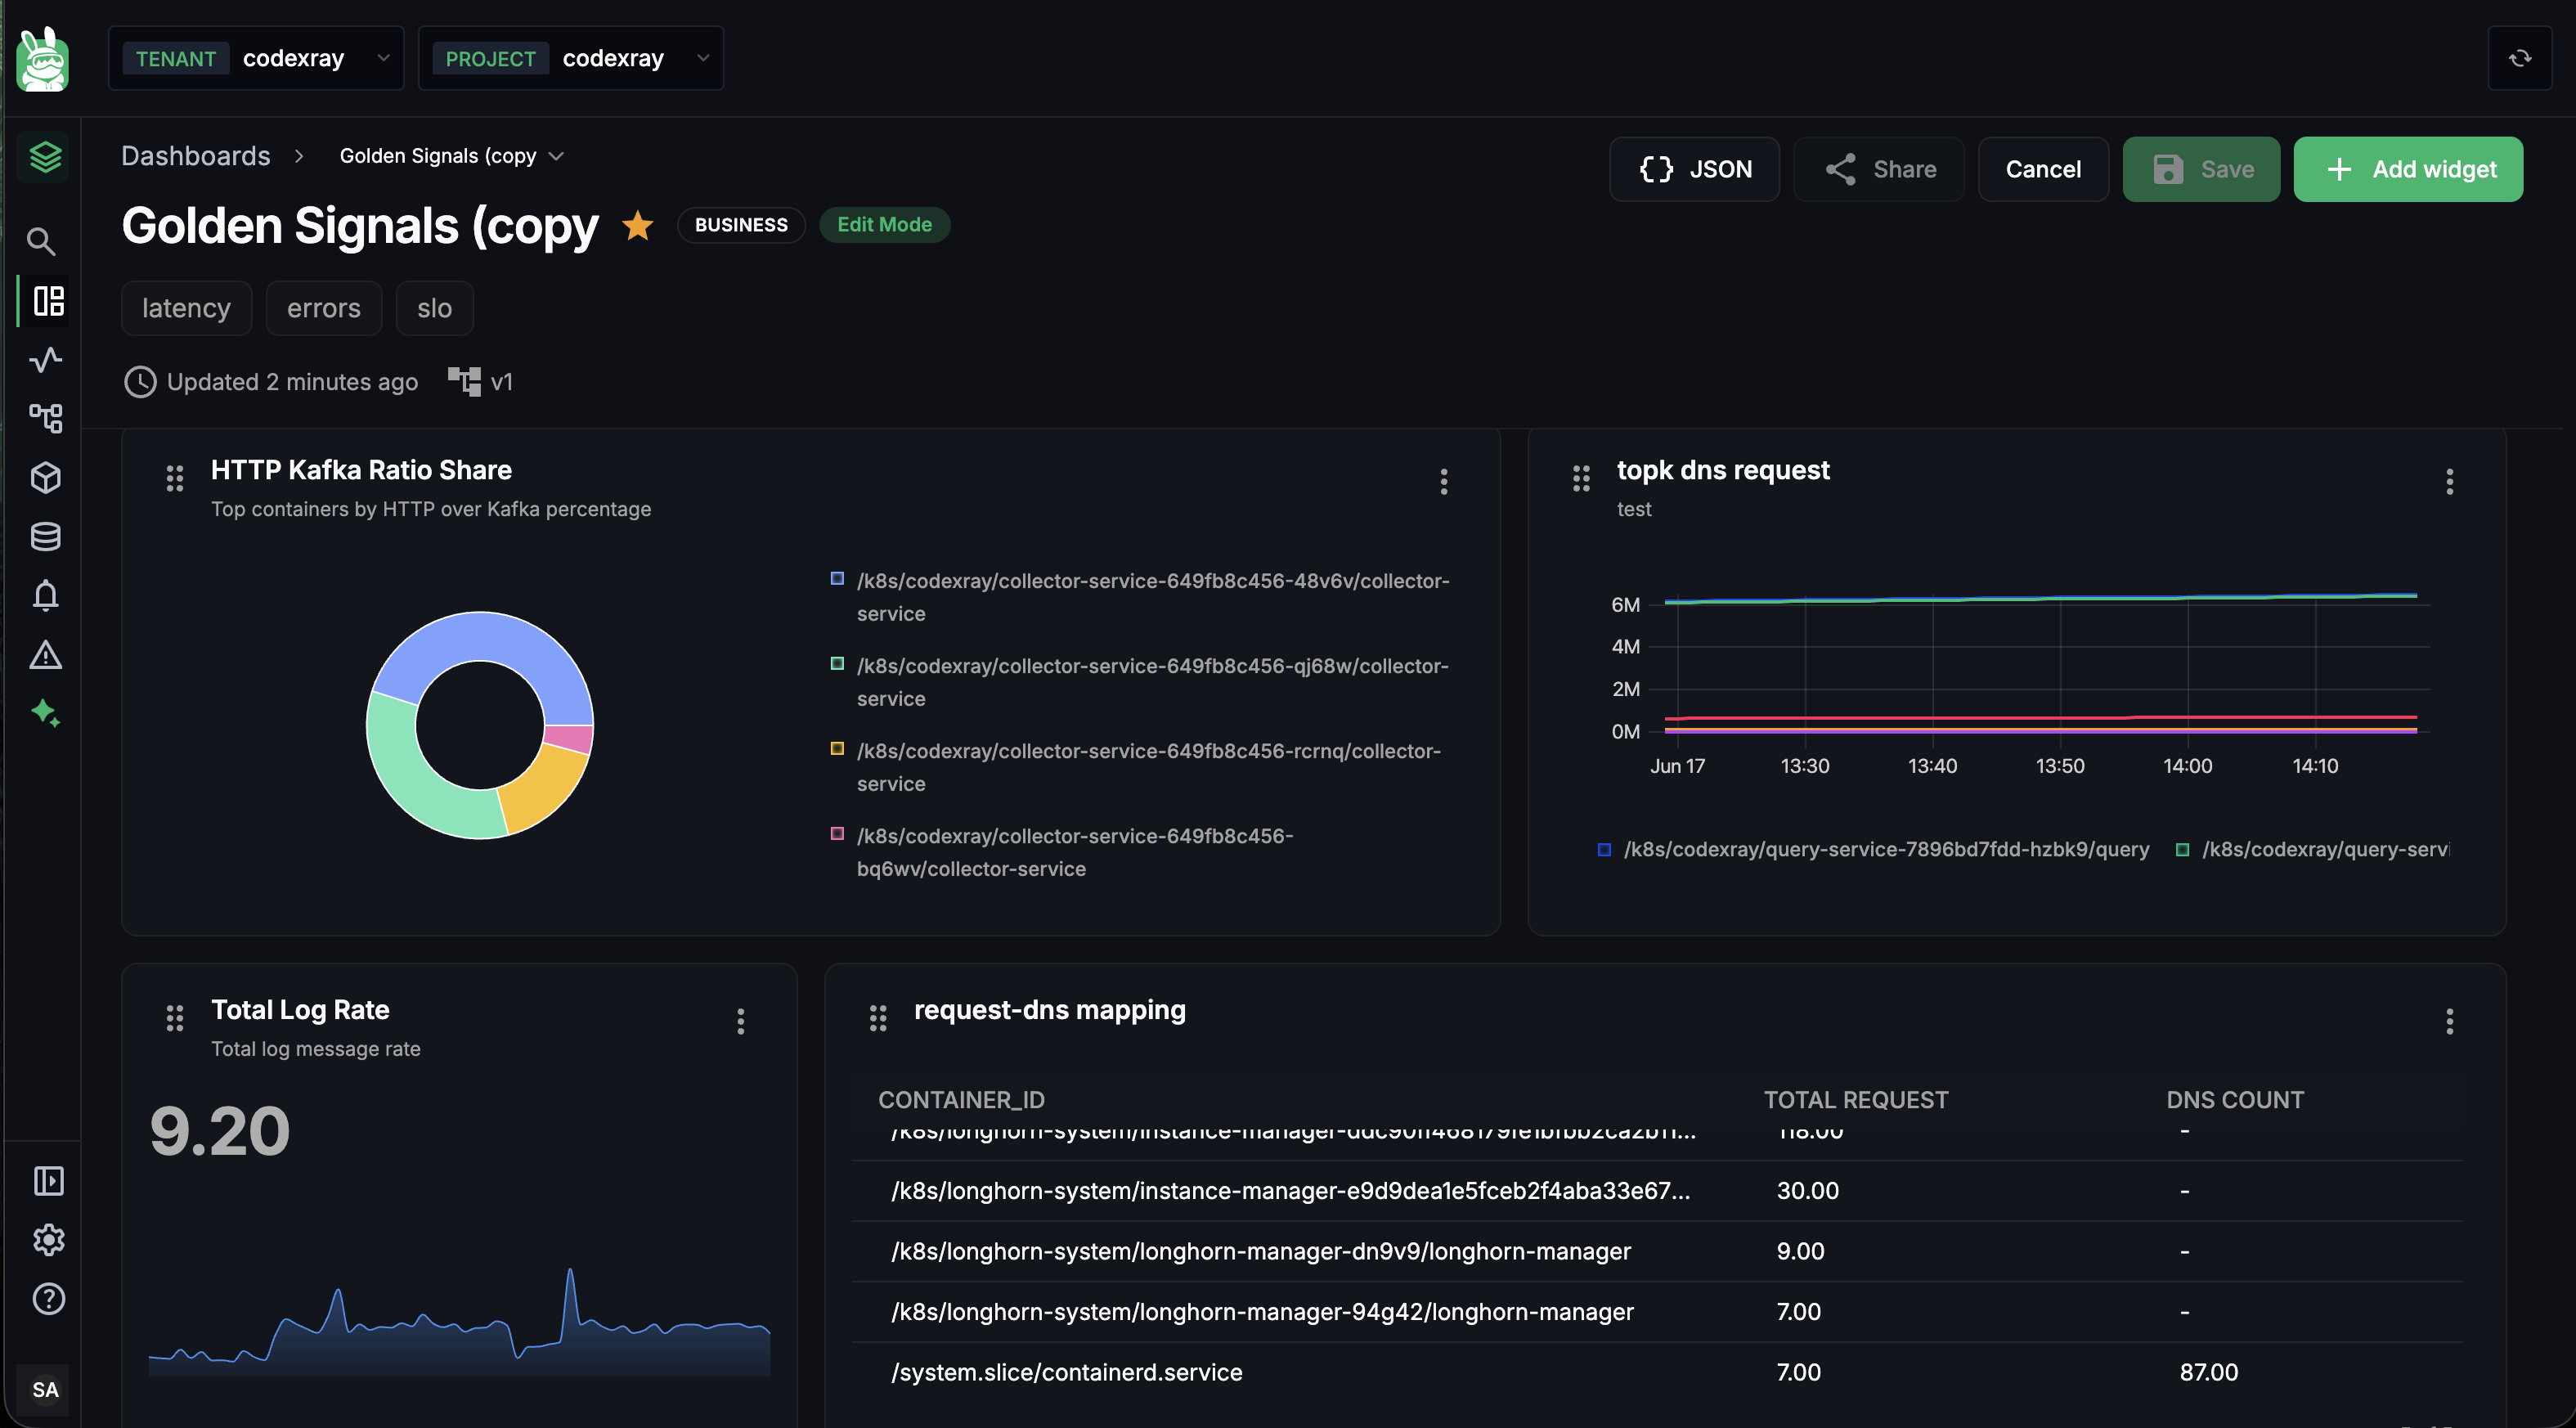
What changes:
- An Edit Mode badge appears next to the type badge in the title row
- The top-right action group becomes: JSON · Share · Cancel · Save · + Add widget
- Each widget gains a drag handle (the ≡ icon top-left of the panel) and an active kebab menu (⋮ top-right) with Edit and Delete actions
- The grid shows resize handles on the bottom-right of each widget
Drag-resize layout
The grid is 24 columns wide with a fixed row height. Two interactions:
| Action | How |
|---|---|
| Move a widget | Grab the ≡ handle in its top-left and drag. Other widgets reflow around the placeholder live. |
| Resize a widget | Grab the resize handle at the bottom-right corner and drag. Widgets snap to whole-column / whole-row increments. |
Minimum widget size is 7 columns × 6 rows — narrow enough to fit three across the grid, tall enough that the panel always has room for axes / legends / titles. Newly added widgets are auto-placed by the layout engine — it fills the last row left-to-right, then wraps to a new row, so you don't need to position anything by hand.
The action buttons in detail
| Button | What it does |
|---|---|
| + Add widget | Opens the Add Widget side panel with the four panel-type cards. See Building Widgets — Adding a widget. |
| JSON | Opens the bulk import dialog (see below) — paste a { "widgets": [...] } array to add many widgets at once. |
| Share | Currently a placeholder for future per-link sharing. Access today is controlled by project-wide RBAC. |
| Save | Persists every change since you entered Edit mode — layout, widget edits, additions, deletions. Disabled (grey) when nothing has changed. |
| Cancel | Discards every change since you entered Edit mode and returns to View mode. The dashboard reverts to what was last saved on the server. |
The Save flow — what actually gets persisted
When you hit Save, three things happen in order:
- The server validates every widget's config — name, query, panel-type-specific required fields (see Required fields and validation rules)
- The full layout (the position and size of each widget) is written to the dashboard's config blob
- The dashboard's version bumps — a new snapshot is added to its Version History — and the
updated_at/updated_byare recorded
If any widget fails validation the whole save is rejected — you stay in Edit mode and the failing panel surfaces an inline error. Fix it and click Save again.
Local drafts — your work survives a refresh
Edits in Edit mode are kept in a local draft in your browser's localStorage before you save. Two stores are used:
custom-dashboard-edit-draft-store— per-widget configuration edits in progresscustom-dashboard-layout-draft-store— pending position/size changes
The drafts are scoped to the dashboard ID, so refreshing the tab or accidentally navigating away doesn't lose work. Cancel explicitly clears the drafts for the current dashboard; Save clears them too once the server confirms the write.
The draft is purely client-side. If you start editing on your laptop and open the same dashboard on a different machine, you won't see the in-progress changes — only the last saved version. Save before switching devices.
Version History
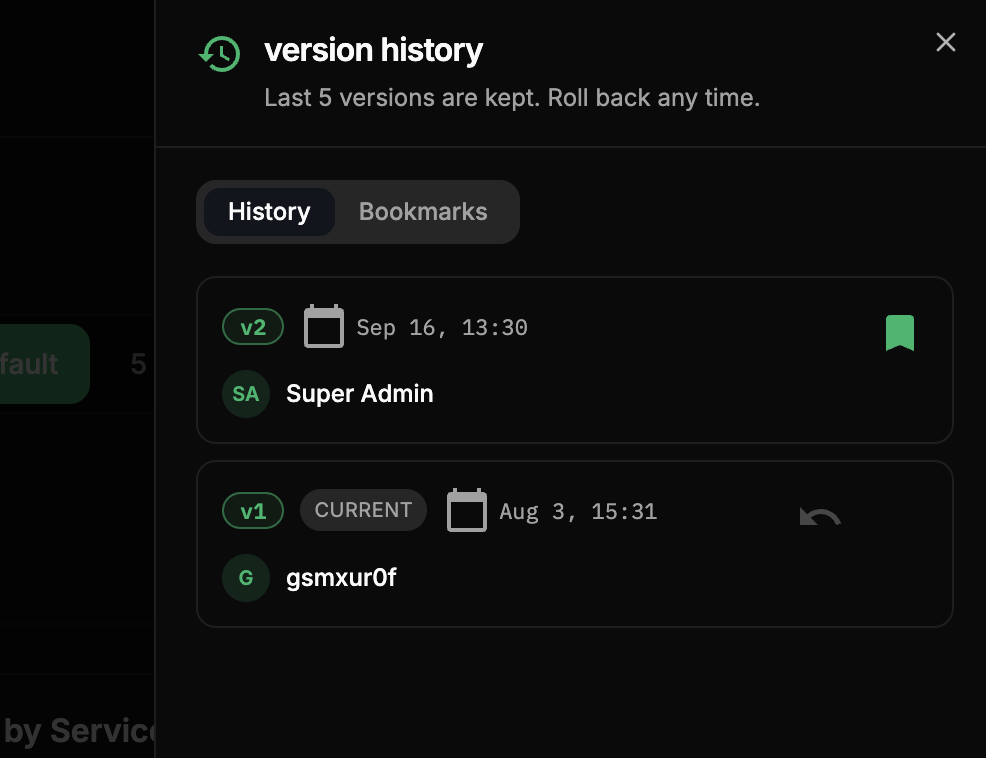
Every time you Save a dashboard, CodeXray keeps a snapshot of it. Version History lets you look back at recent saves and roll back to any of them — so an experiment that didn't work out, or a change you didn't want, is one click to undo.
How versions are created
Versions are created automatically on every Save — there's nothing to name or write a note for. Each save bumps the version number (v1, v2, v3, …), records who saved it and when, and adds it to the history. A brand-new dashboard shows "No version history yet. Saving the dashboard creates the first version." until its first save.
Opening Version History
Open a dashboard in View mode (not Edit mode) and use either:
- the History button in the top-right action group, or
- the
v{n}version badge in the header (the one with the branch icon) — it opens the same panel.
Both open a Version History drawer on the right. It's a read-only view, so it's hidden while you're editing.
The History tab
The History tab keeps the last 5 versions, newest first — "Last 5 versions are kept. Roll back any time." Each entry shows:
| On the card | What it is |
|---|---|
v3 | The version number |
| current chip | Marks the version the dashboard is on right now |
| Date · time | When that version was saved |
| Author | Who saved it |
Restoring a version
Hover a version and click Restore (the undo icon). A confirmation asks "Restore version N?" and explains: "This replaces the current dashboard configuration with the one saved in vN."
Rolling back moves the current pointer back to the chosen version — it doesn't add a new entry. The version you were on stays in history, but drops out once five newer versions exist unless you bookmark it first. If you have unsaved edits, restoring discards them (the dialog warns you). On success you'll see "Restored dashboard to version N."
Bookmarks — keep a version for good
The history only holds the last five saves. To keep an important version beyond that window — a known-good baseline, say — bookmark it with the bookmark icon on the card. Bookmarks:
- are a shared pool of up to 10 per dashboard — everyone on the dashboard sees the same bookmarks ("N of 10 used, shared by everyone on this dashboard.");
- keep their version restorable indefinitely, even after it ages out of the last five (it then shows an outside history chip);
- live on the Bookmarks tab, which has an All / Only Yours filter.
About to rework a dashboard everyone relies on? Bookmark the current version first. If the rework goes sideways, you can restore that exact baseline no matter how many saves happen in between.
Retention and access
| Versions kept | The last 5 saves (rolling) |
| Bookmarks | Up to 10 per dashboard, shared across everyone |
| Created | Automatically — one per Save |
| Who can use it | Edit rights — viewing and restoring history both require edit access |
Version History (and restoring) needs edit rights. For a view-only user the History button and the version badge are disabled, with the tooltip "Viewers cannot access version history."
Bulk JSON Import
For replicating a dashboard from another project, restoring from version control, or laying down a curated starter board, click the JSON button in Edit mode.
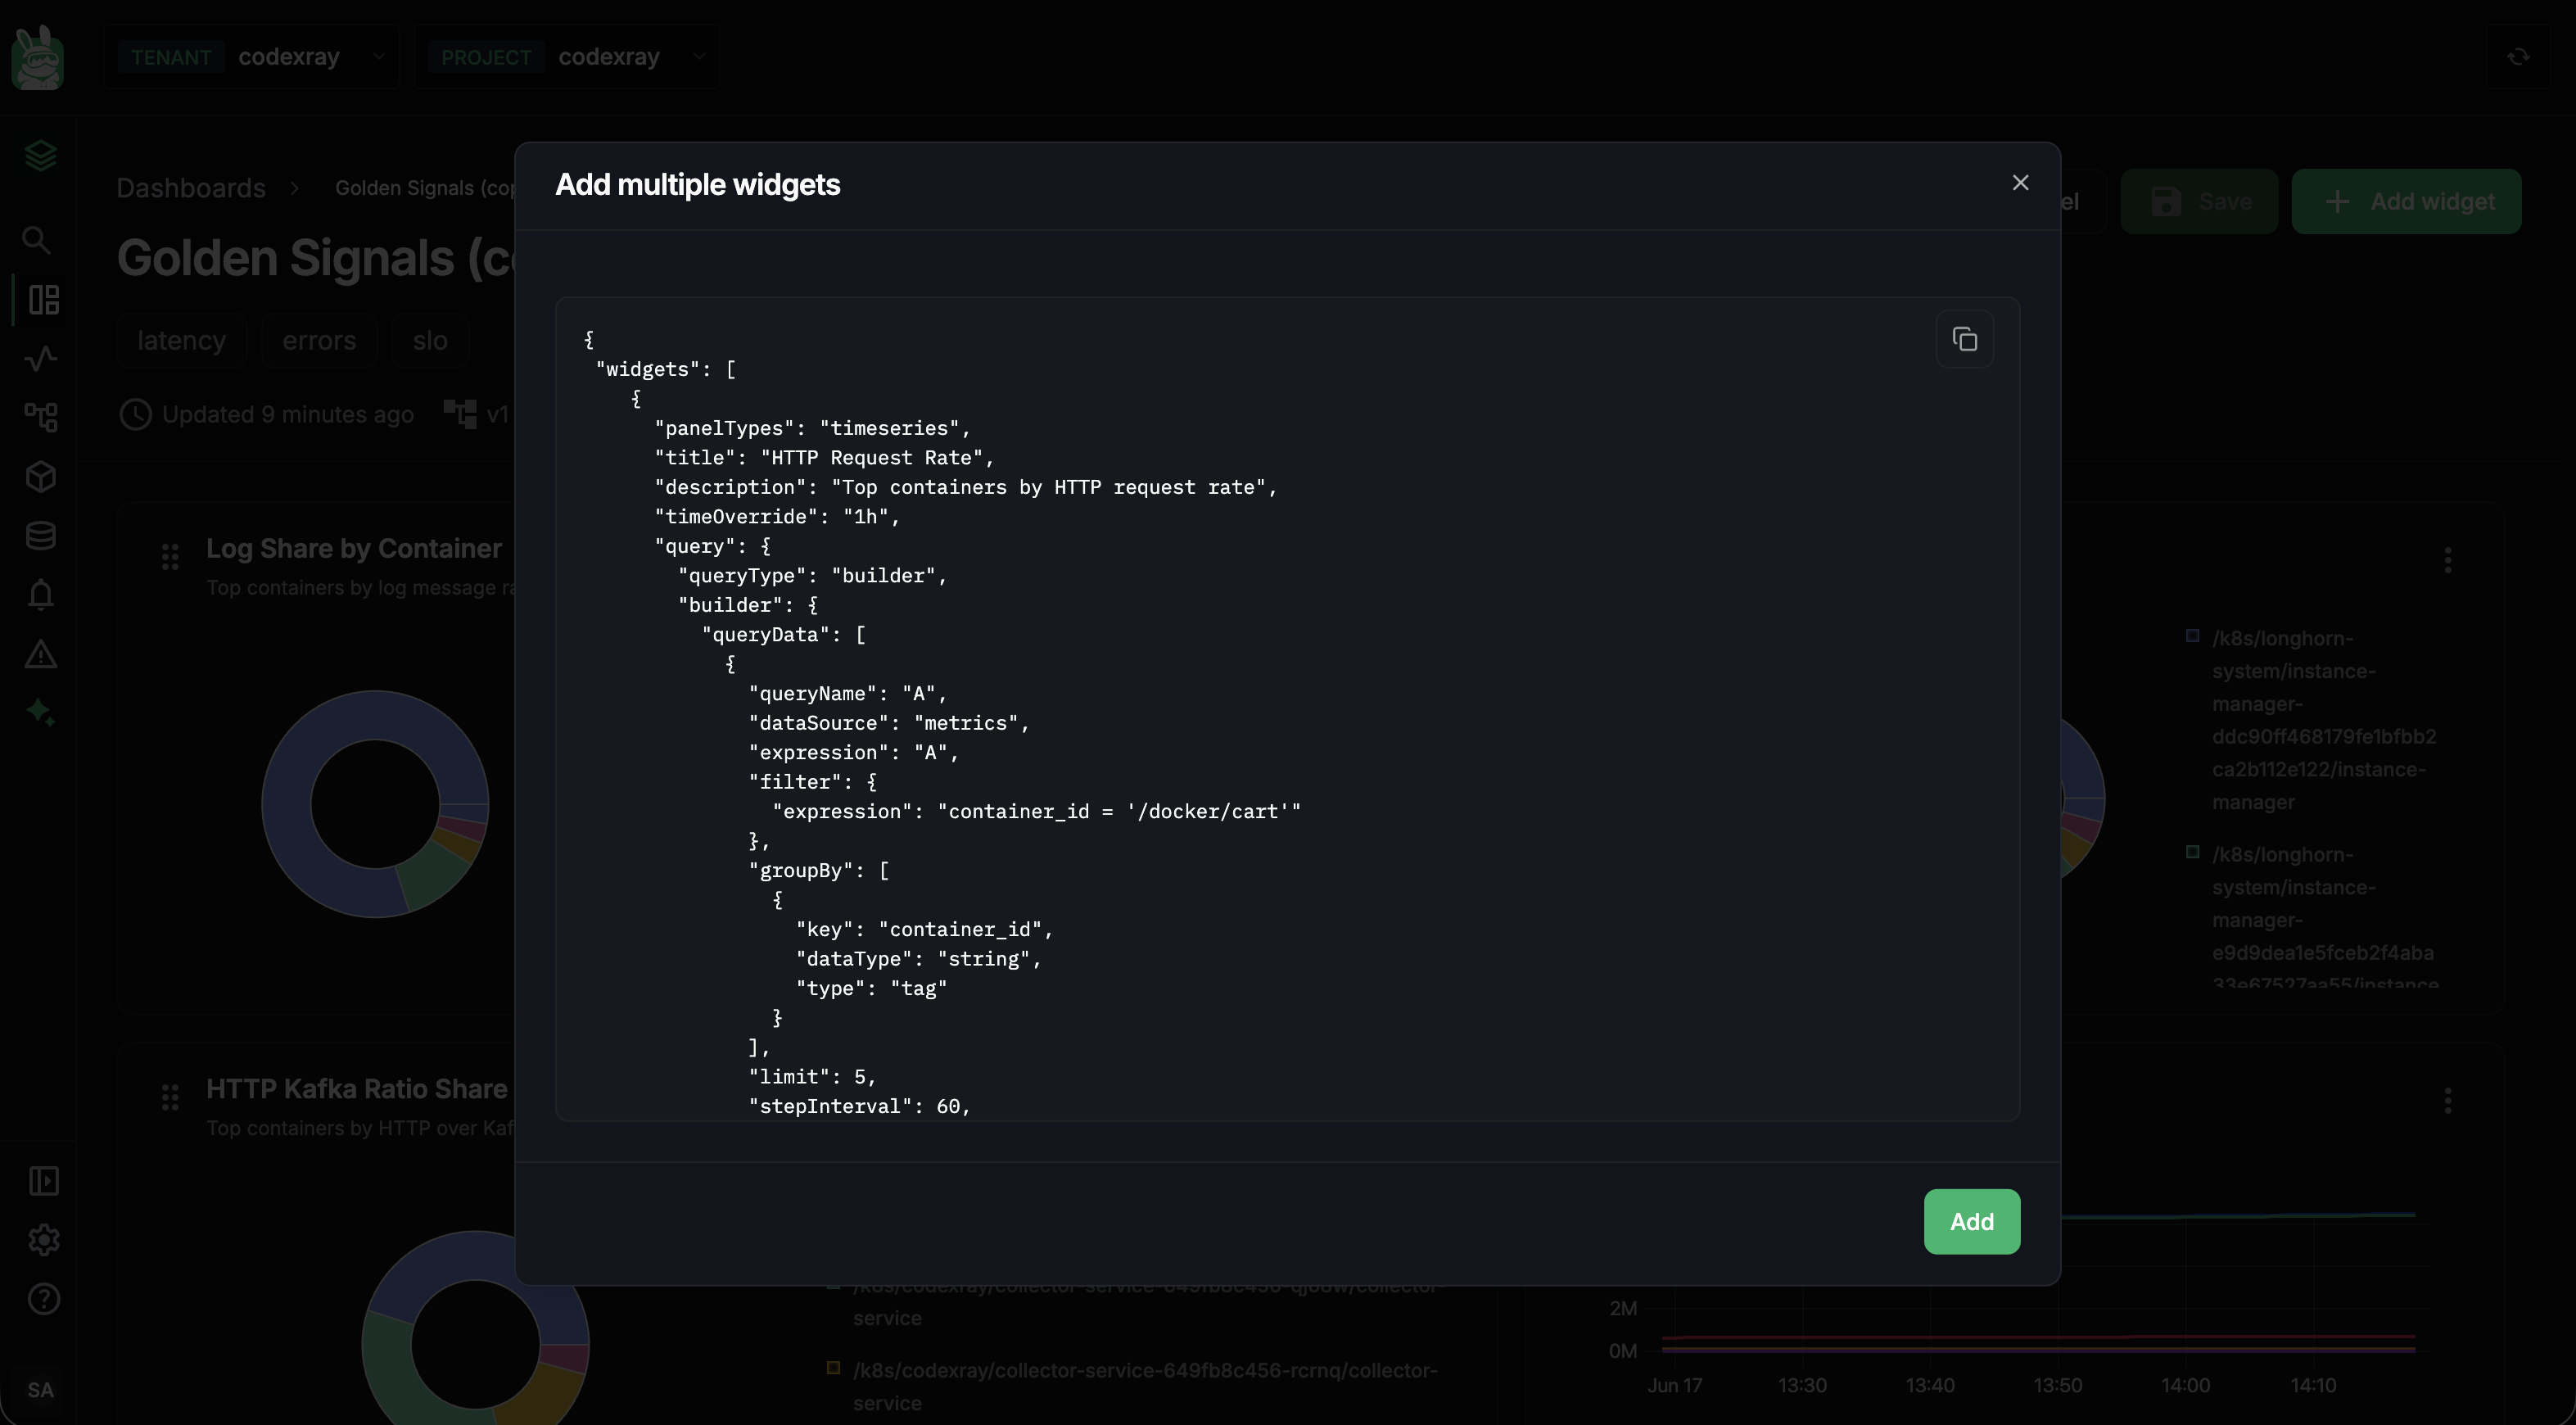
The dialog opens with a starter template showing the exact shape the server expects:
{
  "widgets": [
    {
      "panelTypes": "timeseries",
      "title": "HTTP Request Rate",
      "description": "Top containers by HTTP request rate",
      "timeOverride": "1h",
      "query": {
        "queryType": "builder",
        "builder": { ... }
      }
    },
    { ... }
  ]
}
Rules to remember
- Up to 10 widgets per paste (server cap). For more, paste in multiple batches.
- Each widget is validated independently — a malformed entry doesn't reject the whole array; valid ones are added, failures are reported per-index.
- No layout in the JSON — the dashboard's auto-placement engine slots new widgets into the next free grid spot. Arrange after pasting.
- Metric names are not validated at import time — a widget with a metric that doesn't exist in your environment will import fine and just render NO DATA until the metric appears. If you're pasting a JSON exported from a different cluster, this is the most common cause of empty panels.
Per-widget JSON editing
For a small tweak inside one widget, you don't need the bulk dialog — open the widget in the editor and switch to the JSON tab. The whole widget's config appears as editable JSON, and Run validates + previews it the same way the Query Builder does. See Building Widgets — The JSON tab.
The full paste-and-auto-place flow is the last 15 seconds of the Power Features clip on the Building Widgets page.
Deleting a Dashboard
From the list view, hover a card and the kebab menu (⋮) offers Delete. A confirmation modal walks you through the deletion — once confirmed the dashboard and every widget inside it are removed.
Version History can restore a previous version of an existing dashboard, but it can't bring back a deleted dashboard — there's no soft-delete or undo for deletion. Keep a JSON export if you might want it back.
A Common First-Day Flow
A typical path through the module when you're setting up a new dashboard:
- Open Dashboards → + New dashboard. Pick a type (
Customis fine), add a few tags (prod,payments,latency), hit Create. - Click Edit on the empty board.
- + Add widget → pick Time Series. Build your first chart using the Query Builder.
- Click Run in the editor to see data, tweak until it's right, click Add to Dashboard.
- Back on the dashboard, drag the new widget into the position you want and resize to fit.
- Repeat steps 3–5 for two or three more widgets, mixing panel types.
- Click Save. The version bumps; everyone with view access now sees it.
- Star the dashboard from the list view so it stays at the top of yours.
Next Steps
- Custom Dashboards — Overview — the concepts, the panel/query-mode matrix, every server-enforced limit in one table
- Building Widgets — the editor anatomy, three query modes, Query Builder deep dive, per-panel required fields, metric types, formulas
- Role-Based Access Control — who can see and edit dashboards