Building Widgets
A widget is the unit a dashboard is made of — a panel type drawn from a query, with a title and a time range. This page walks the editor end-to-end: every control, every panel type's rules, what each aggregation actually does, the formula bar, and the validation errors you'll hit if you skip something.
If you haven't read the Overview yet, do that first — it's the conceptual map. This page is the operator's manual.
Adding a Widget
From a dashboard in Edit mode, click + Add widget in the top-right. A right-side panel slides in offering the four panel types.
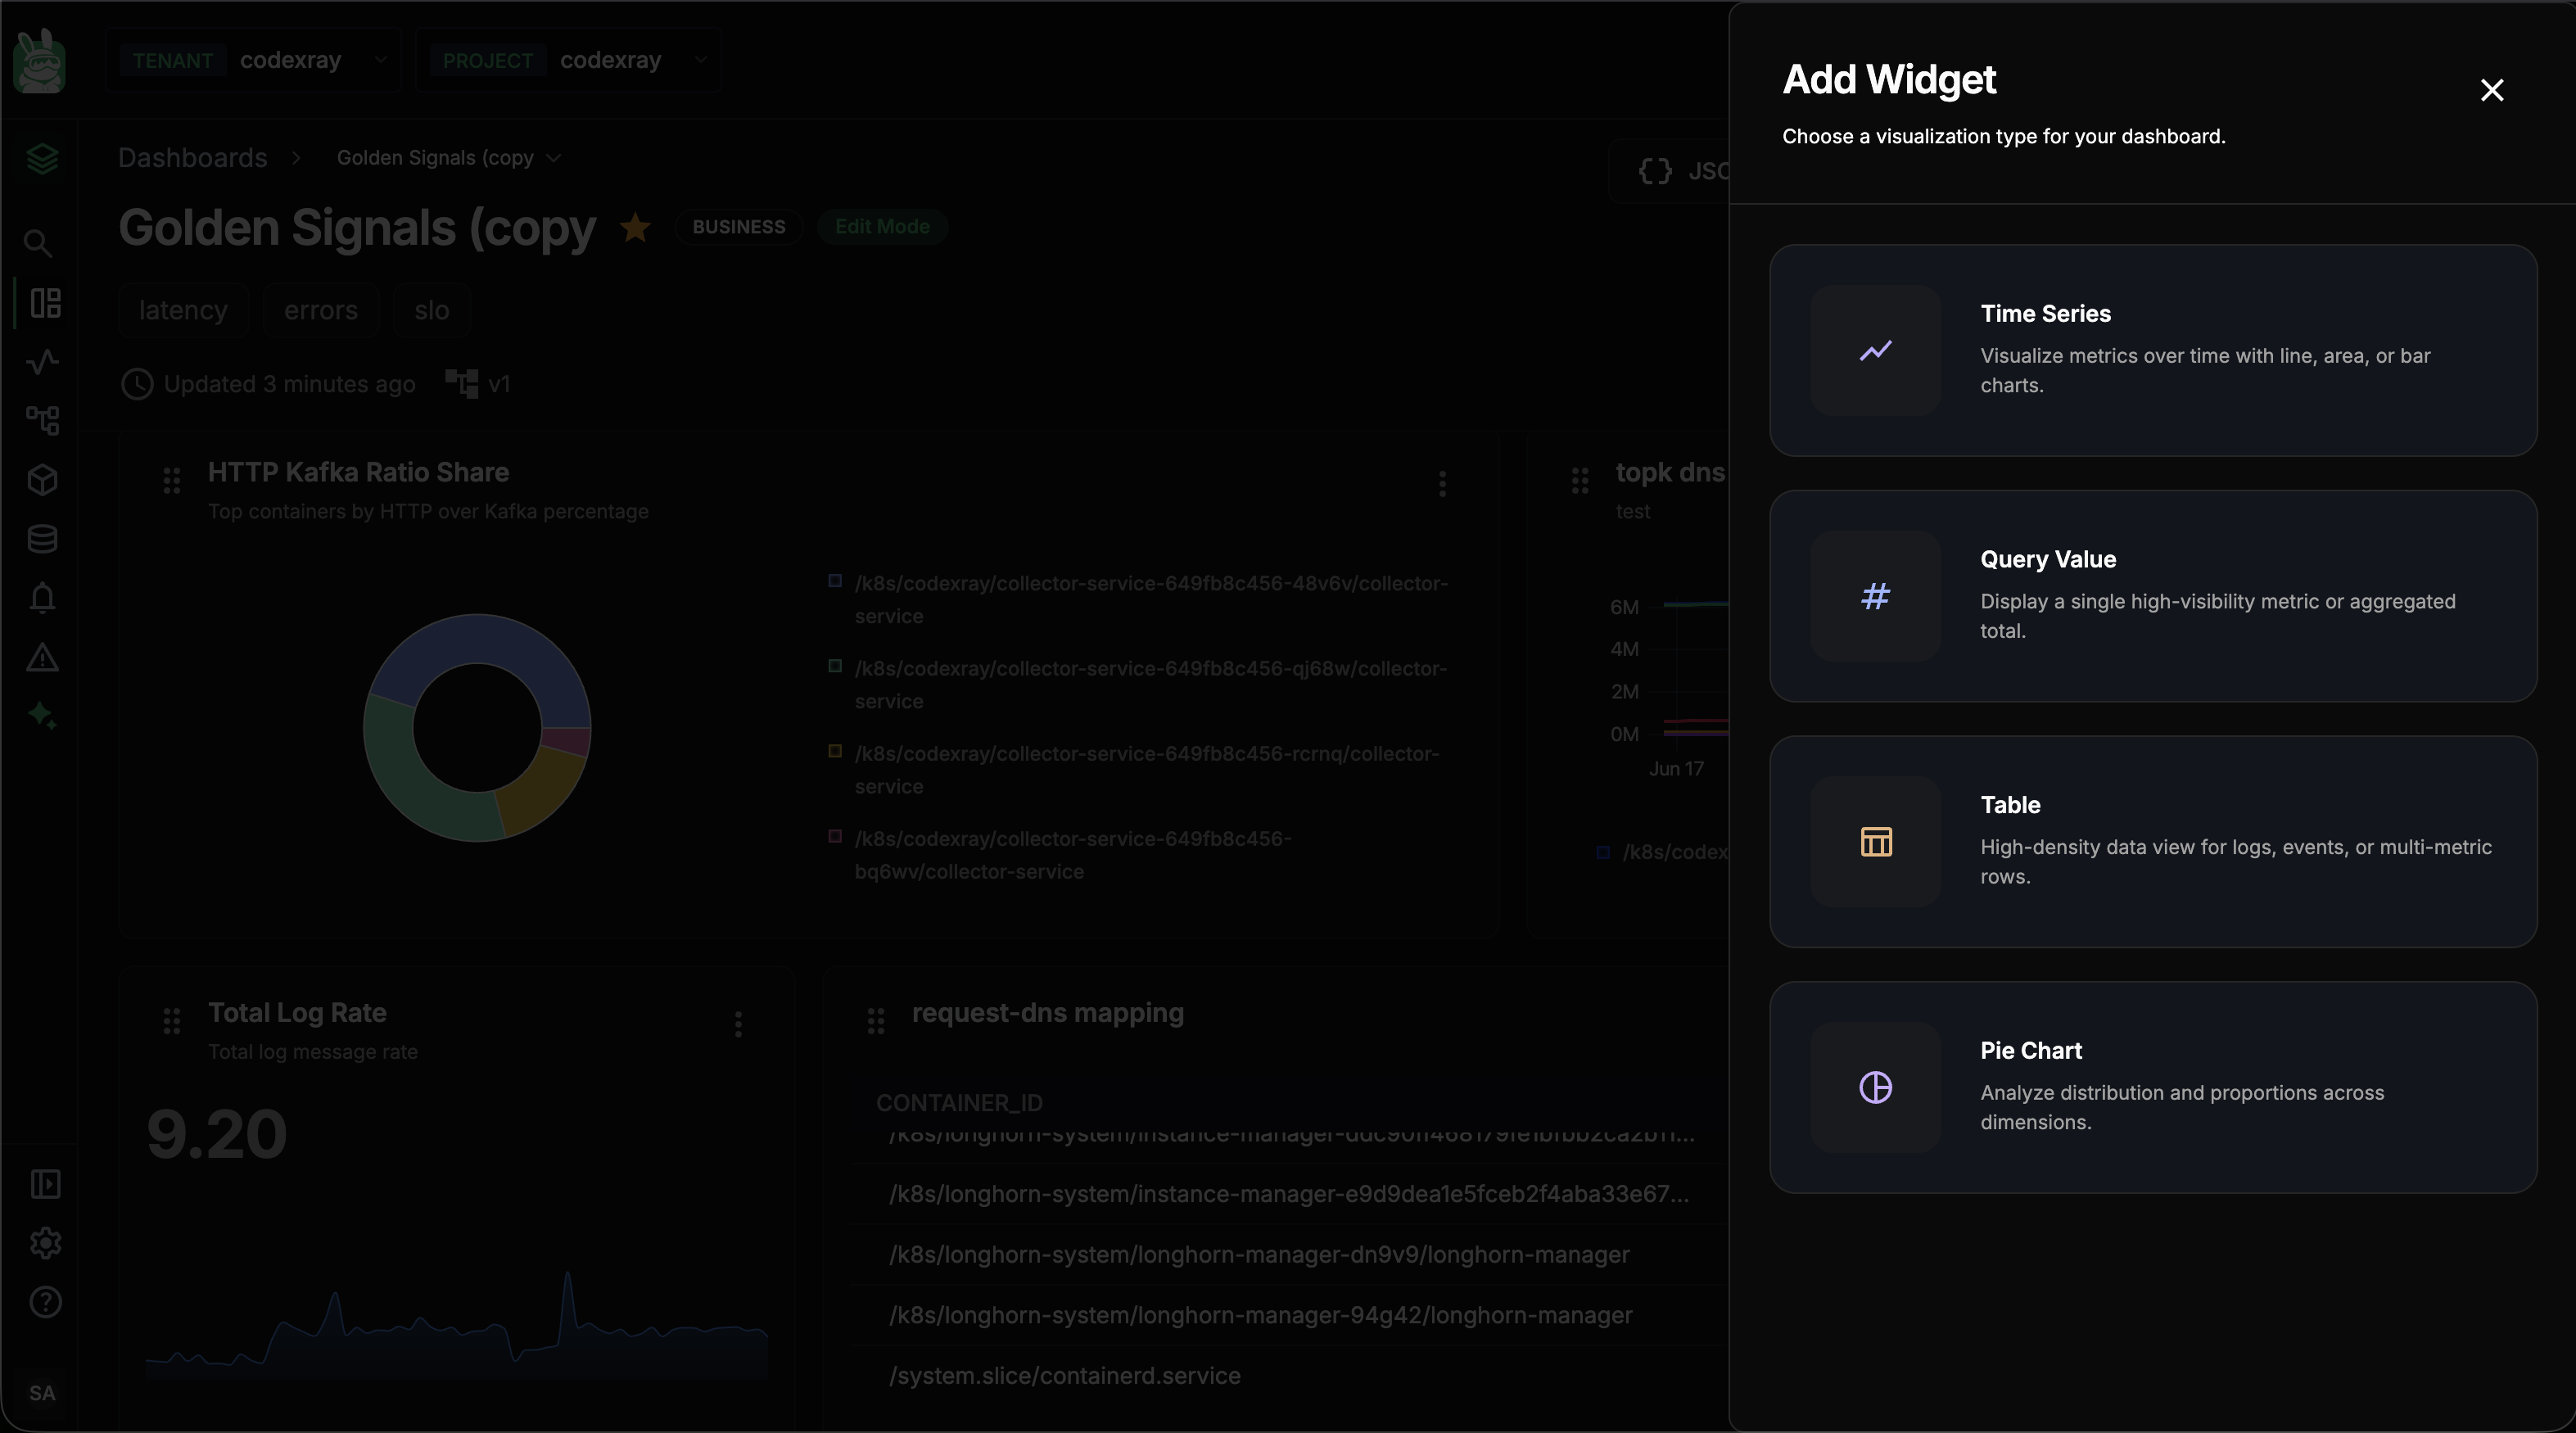
| Panel | Card description | Pick when |
|---|---|---|
| Time Series | Visualize metrics over time with line, area, or bar charts. | You want a trend over time — request rate, latency, CPU |
| Query Value | Display a single high-visibility metric or aggregated total. | You want a single KPI tile — total requests, current users |
| Table | High-density data view for logs, events, or multi-metric rows. | You want a list of entities with multiple metrics per row |
| Pie Chart | Analyze distribution and proportions across dimensions. | You want to see share — who contributes how much |
Click a card and you land in the widget editor, which is where the rest of this page lives. (You can also change panel type from the editor's right-side panel — see The editor anatomy.)
Power Features in Action
Three of this page's bigger ideas — the pie validation rule, PromQL mode, and bulk JSON import — all show up in this single 60-second clip. Watch once, then dive into the reference below.
What's covered, in order:
| In the clip | Where to read more |
|---|---|
| Pie chart with no group-by → red validation error → fix | Required fields — Pie Chart |
| Switching to PromQL tab (Time Series only) and pasting an expression | The PromQL tab |
JSON button → paste a { "widgets": [...] } array → three widgets auto-placed | Managing Dashboards — Bulk JSON Import |
The Editor Anatomy
The editor has three regions. The same layout is used for every panel type and every query mode.
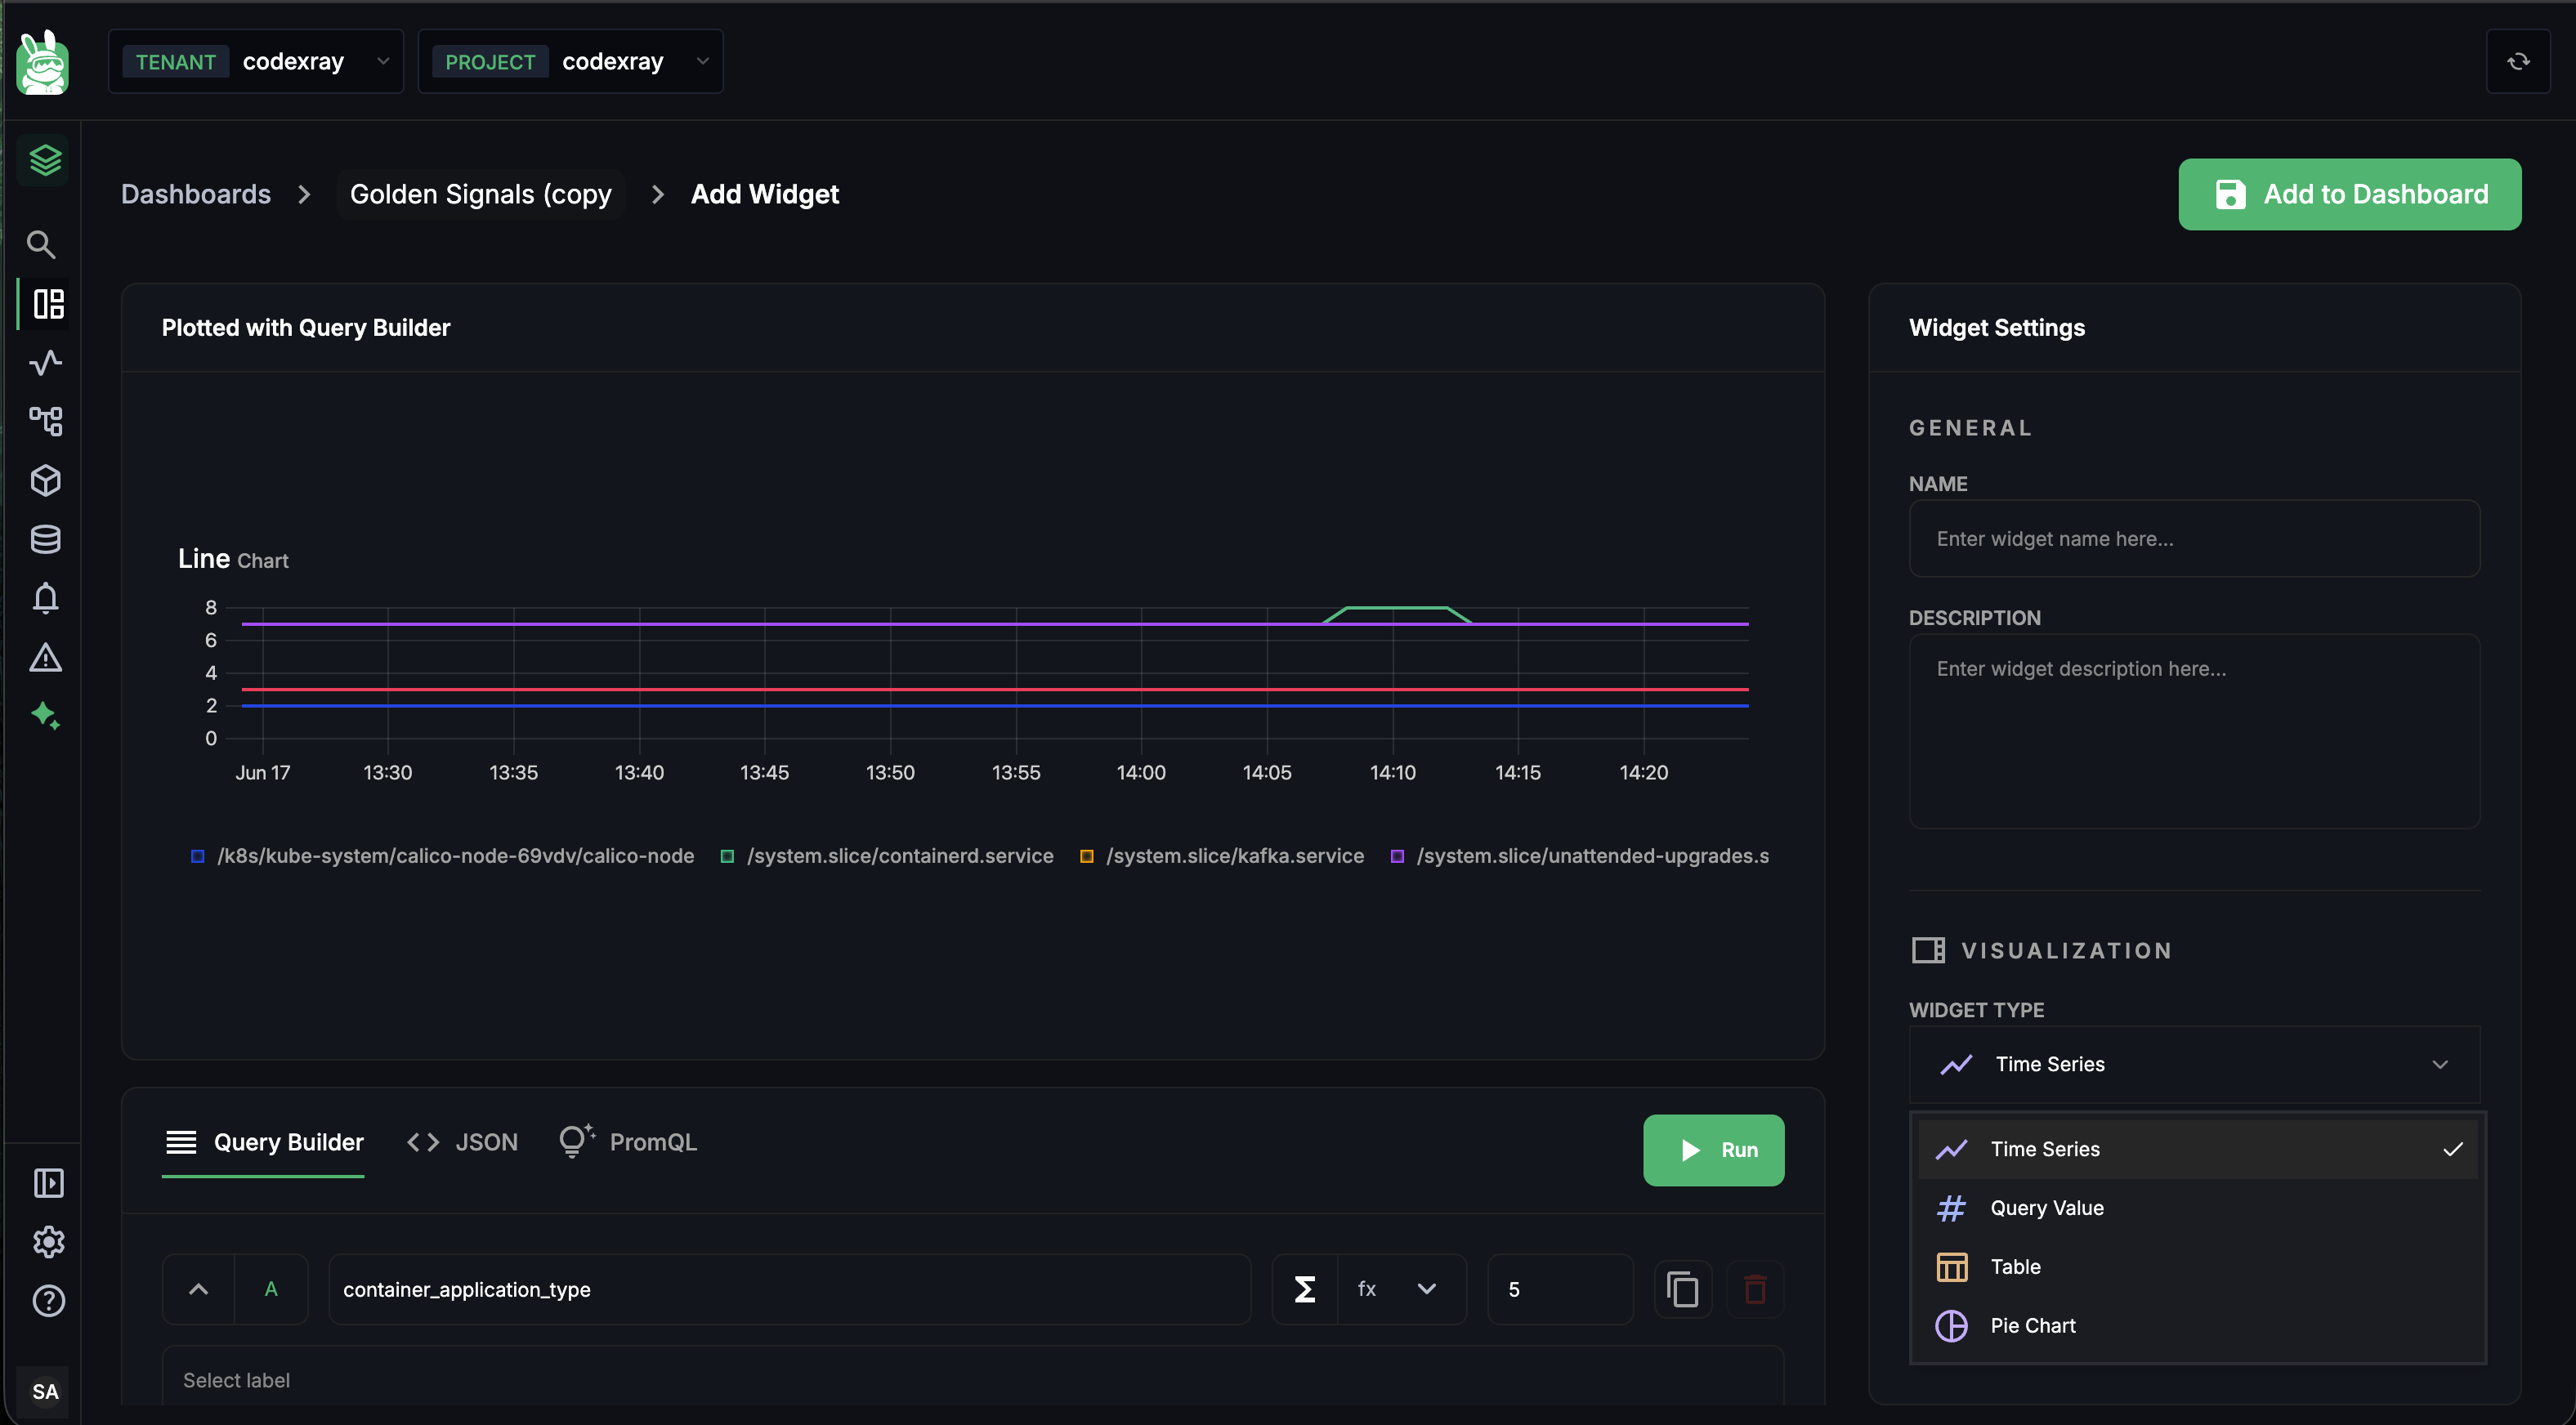
1. The preview (top-left, large)
The whole upper-left area is a live preview labelled with the active query mode (Plotted with Query Builder / JSON / PromQL). It shows nothing until you click Run; then it renders exactly what the saved widget will render. Errors appear here in red — see Required fields and validation rules for the common ones.
2. The query area (bottom-left)
Below the preview is the query mode tab bar and a Run button:
| Tab | Visible on | Notes |
|---|---|---|
| Query Builder | All panel types | Default; visual; compiles to PromQL |
| JSON | All panel types | Raw widget config |
| PromQL | Time Series only | Raw PromQL; hidden for Query Value / Pie / Table |
Click Run to execute the query and update the preview. Each tab has its own form (see The three query modes).
3. Widget Settings (right side panel)
The right rail carries two groups:
GENERAL
- NAME — display name shown in the panel header (1–80 chars; pattern
^[A-Za-z0-9 _.,:();\-]+$) - DESCRIPTION — sub-text under the name (0–300 chars)
VISUALIZATION
- WIDGET TYPE — pick or change the panel type from the dropdown. Changing it from here is the same as picking from the Add Widget side panel. The dropdown re-renders the query area's tab bar (PromQL appears/disappears).
- WIDGET TIME PREFERENCE —
5m·15m·30m·1h·2h·3h. Per-widget, not dashboard-wide.
The Add to Dashboard button at the top-right of the editor commits the widget. It's disabled until the widget passes validation — see the required-fields rules below.
The Three Query Modes
Each tab inside the editor is a different way of saying "here's what to fetch". Pick whichever fits the job. The same widget can switch modes — switching does not preserve state across tabs, so don't bounce between them mid-build.
Query Builder
The default and the most discoverable. Pick a metric, add filters, choose how to aggregate. Compiles to PromQL behind the scenes — the Formula row even shows the resolved expression as a preview.
A query row looks like this (one per metric — A, B, C…):
[A] [metric name field] [Σ] [fx ▾] [limit] [copy] [delete]
| Control | What it does |
|---|---|
A / B / C … | Query letter — referenced by formulas |
| Metric name field | Type-ahead autocomplete against every metric in your project. Start typing container_ and the dropdown filters. |
| Σ (sigma) | Quick aggregation. Opens a small popover so you can change the space-aggregation (sum / avg / min / max / count / topk) without leaving the row. |
fx ▾ | Function selector — applies a built-in transformation (rate, irate, increase, histogram_quantile, math functions like round, abs, etc.). See the full list in The fx menu. |
| limit | Cap on the number of returned series. Set to 1 for Query Value; set to 5 for top-5 multi-series charts. Server caps apply (5 for time series top-K, 20 elsewhere). |
| copy icon | Duplicates this query row as a new letter |
| delete icon | Removes this query row |
Underneath the row, three further controls expand:
- Select label — adds a filter chip. Pick a label key from the dropdown, then a value (or operator + value). The chip appears inline; click the × on the chip to remove. Up to 5 filters per query (server-enforced).
- Aggregate within time series + every N Minutes — the time aggregation (rate / increase / avg_over_time / min_over_time / etc.) + the step interval the rollup uses.
- Aggregate across time series + by
<label>— the space aggregation (sum / avg / min / max / count / topk) + the group-by label that defines what each output series is. Empty group-by = one series for the whole query.
The + button below the last row adds a new query (A → B → C). Adding a second query enables the Formula bar (see Formulas).
The JSON tab
Switching to JSON shows the raw widget config that the server stores. Edit any field directly and click Run to validate + preview. Useful for:
- Tiny tweaks awkward in the builder (e.g., setting
stepInterval: 30instead of the default 60) - Replicating a widget across dashboards (copy the JSON from one widget into the bulk import dialog of another dashboard)
- Authoring widgets programmatically in CI
The schema is the same one documented in Managing Dashboards — Bulk JSON Import.
The PromQL tab — Time Series only
For Time Series widgets only, a third tab gives you a raw PromQL editor.
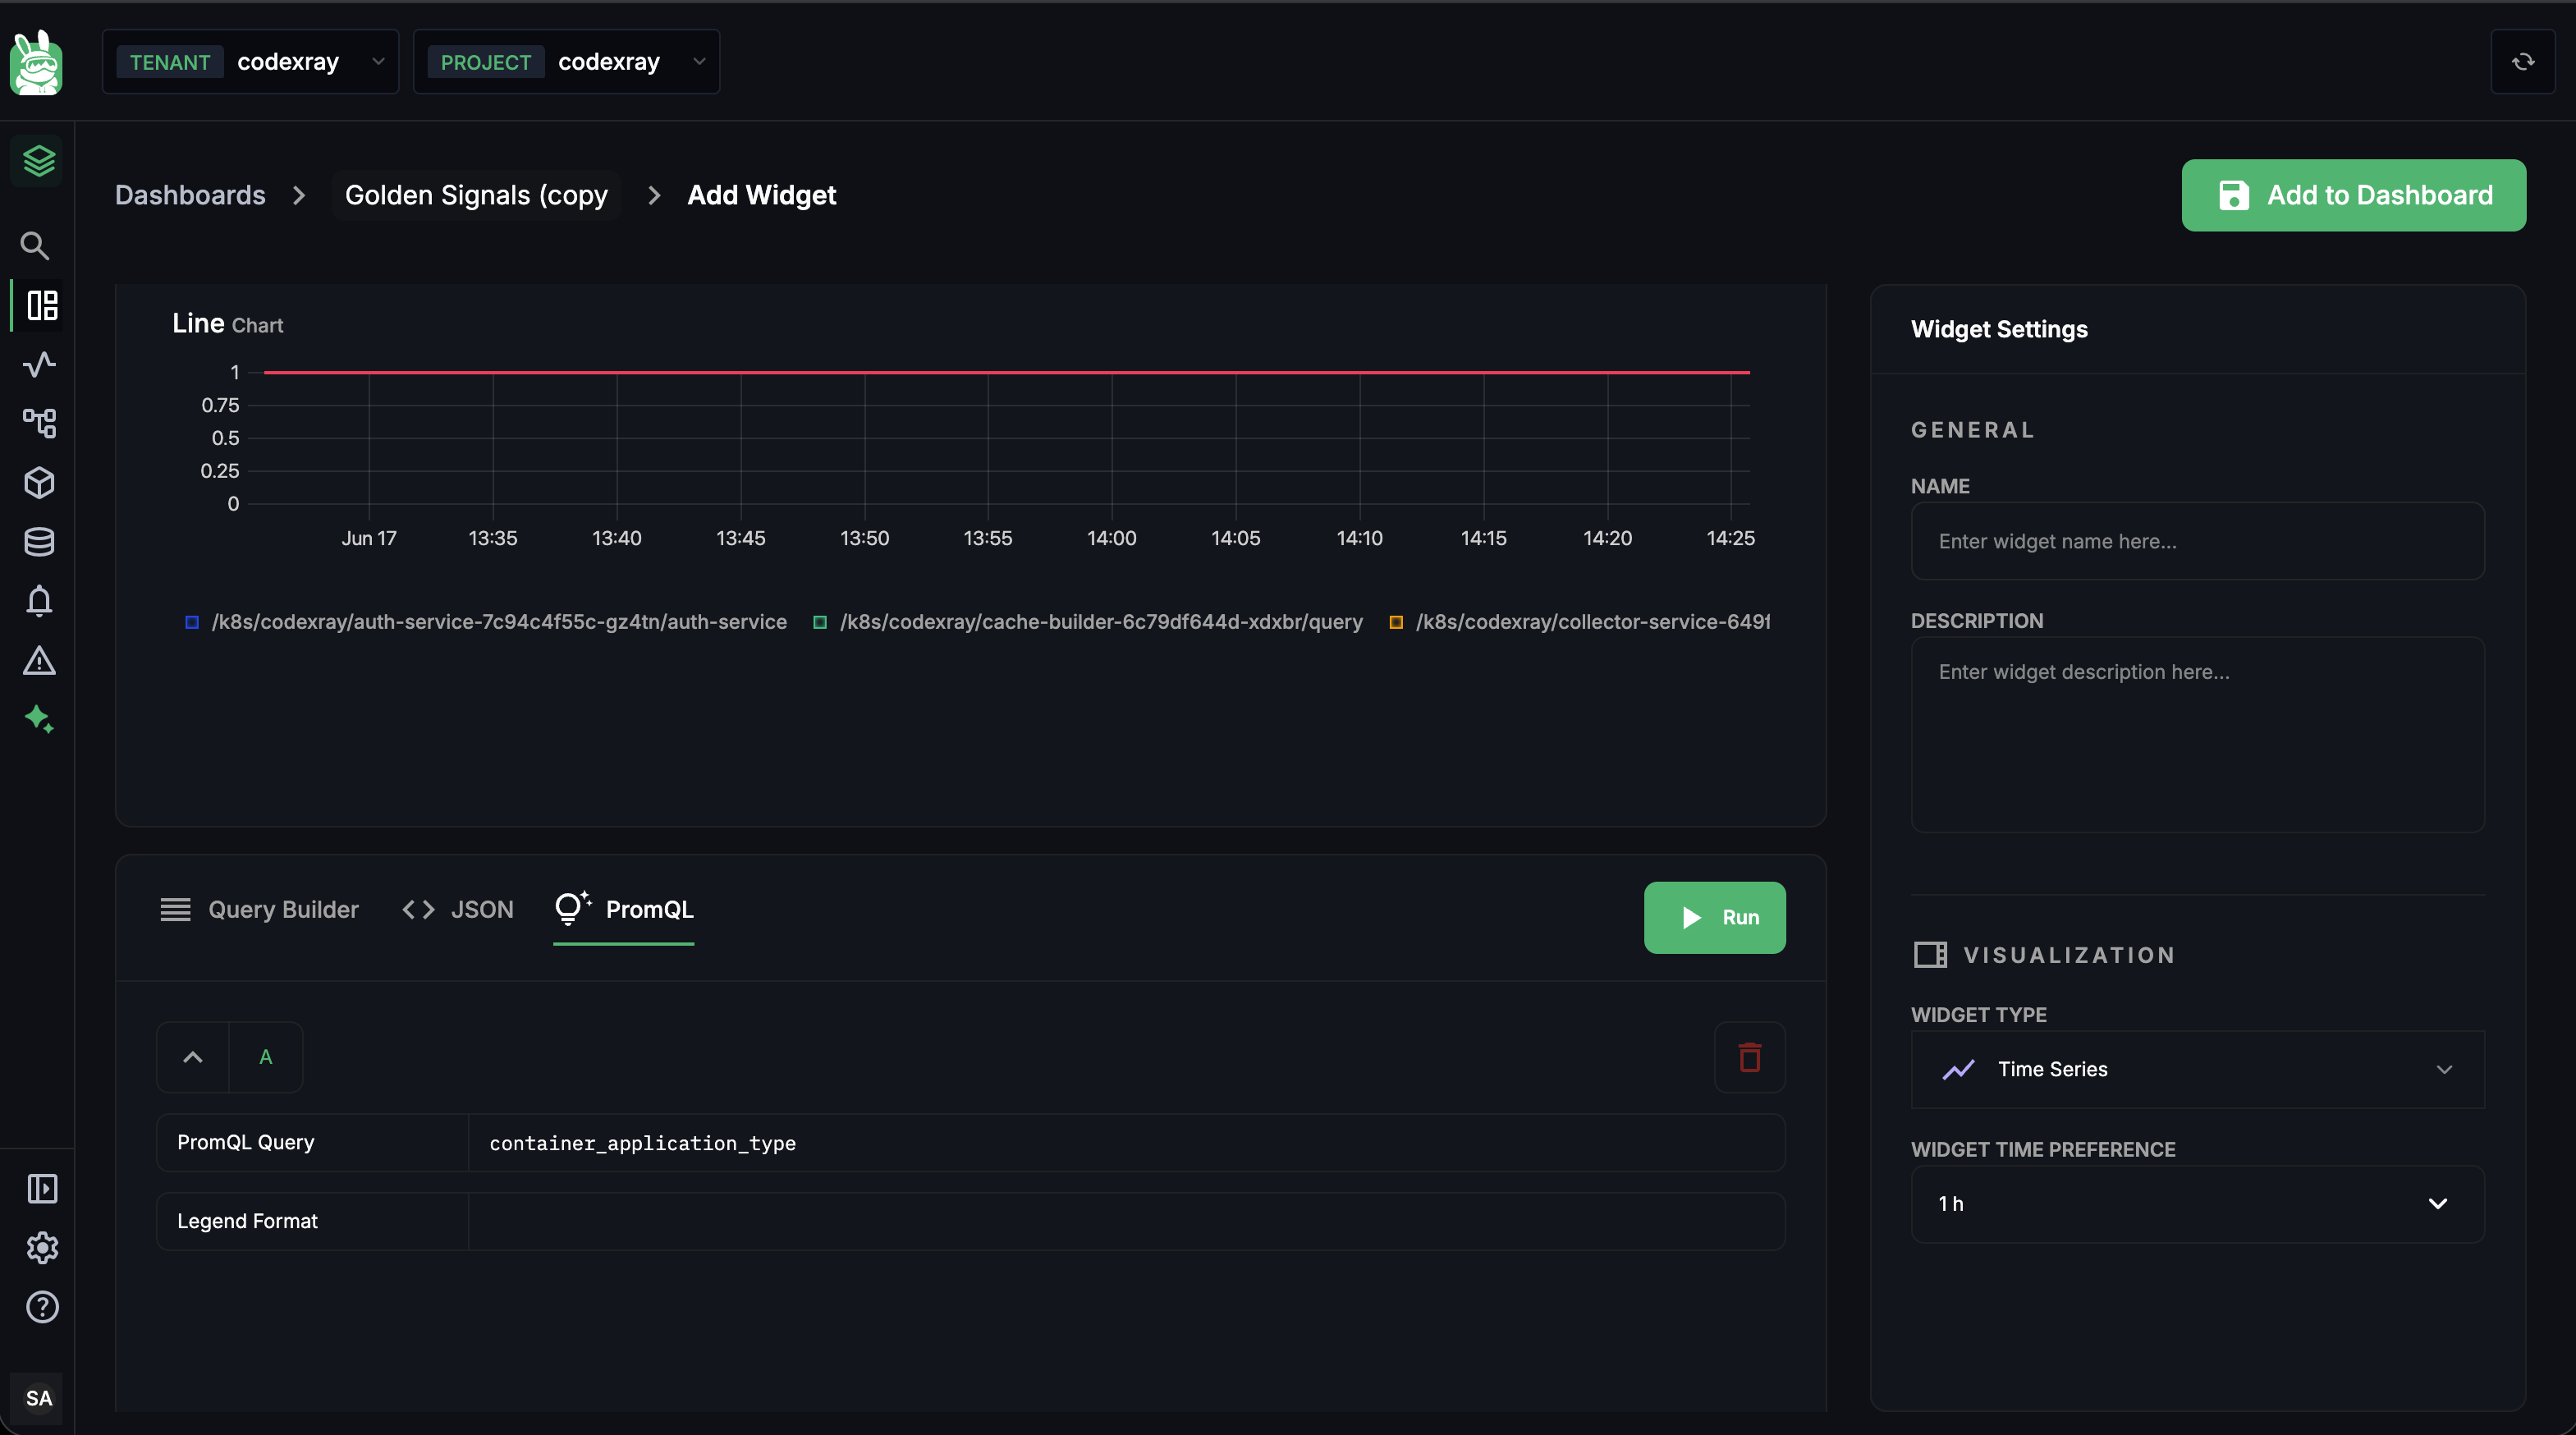
Two fields:
| Field | What it does |
|---|---|
| PromQL Query | Any valid PromQL expression. Result must be an instant or range vector — i.e. data over time. |
| Legend Format | Optional template for the series labels in the legend, e.g. {{container_id}}. Empty = default formatting. |
Use PromQL mode when you need something the builder doesn't surface — histogram quantiles, complex multi-metric arithmetic, or any function past the fx menu. Returns are capped at 5 series per PromQL query (server-enforced) — narrow with label filters in the expression itself.
The PromQL paste, the {{container_id}} legend format, and the Run are the middle section of the Power Features clip at the top of this page.
Required Fields and Validation Rules
Every panel type enforces a slightly different minimum. The editor surfaces these as inline errors in the preview when you click Run, and disables Add to Dashboard until they pass.
Universal rules
These apply to every panel type, every query mode:
- At least one query row with a non-empty metric name is required. Empty query rows trigger "Query A requires a metric".
- Widget Name is required before save (the editor blocks Add to Dashboard otherwise).
- Filter labels can't be one of the five blocked high-cardinality labels (
trace_id,span_id,request_id,session_id,pod_uid).
Pie Chart — exactly one group-by
Pie widgets fail loudly without a group-by. This is the most common new-user mistake — and the editor calls it out clearly:
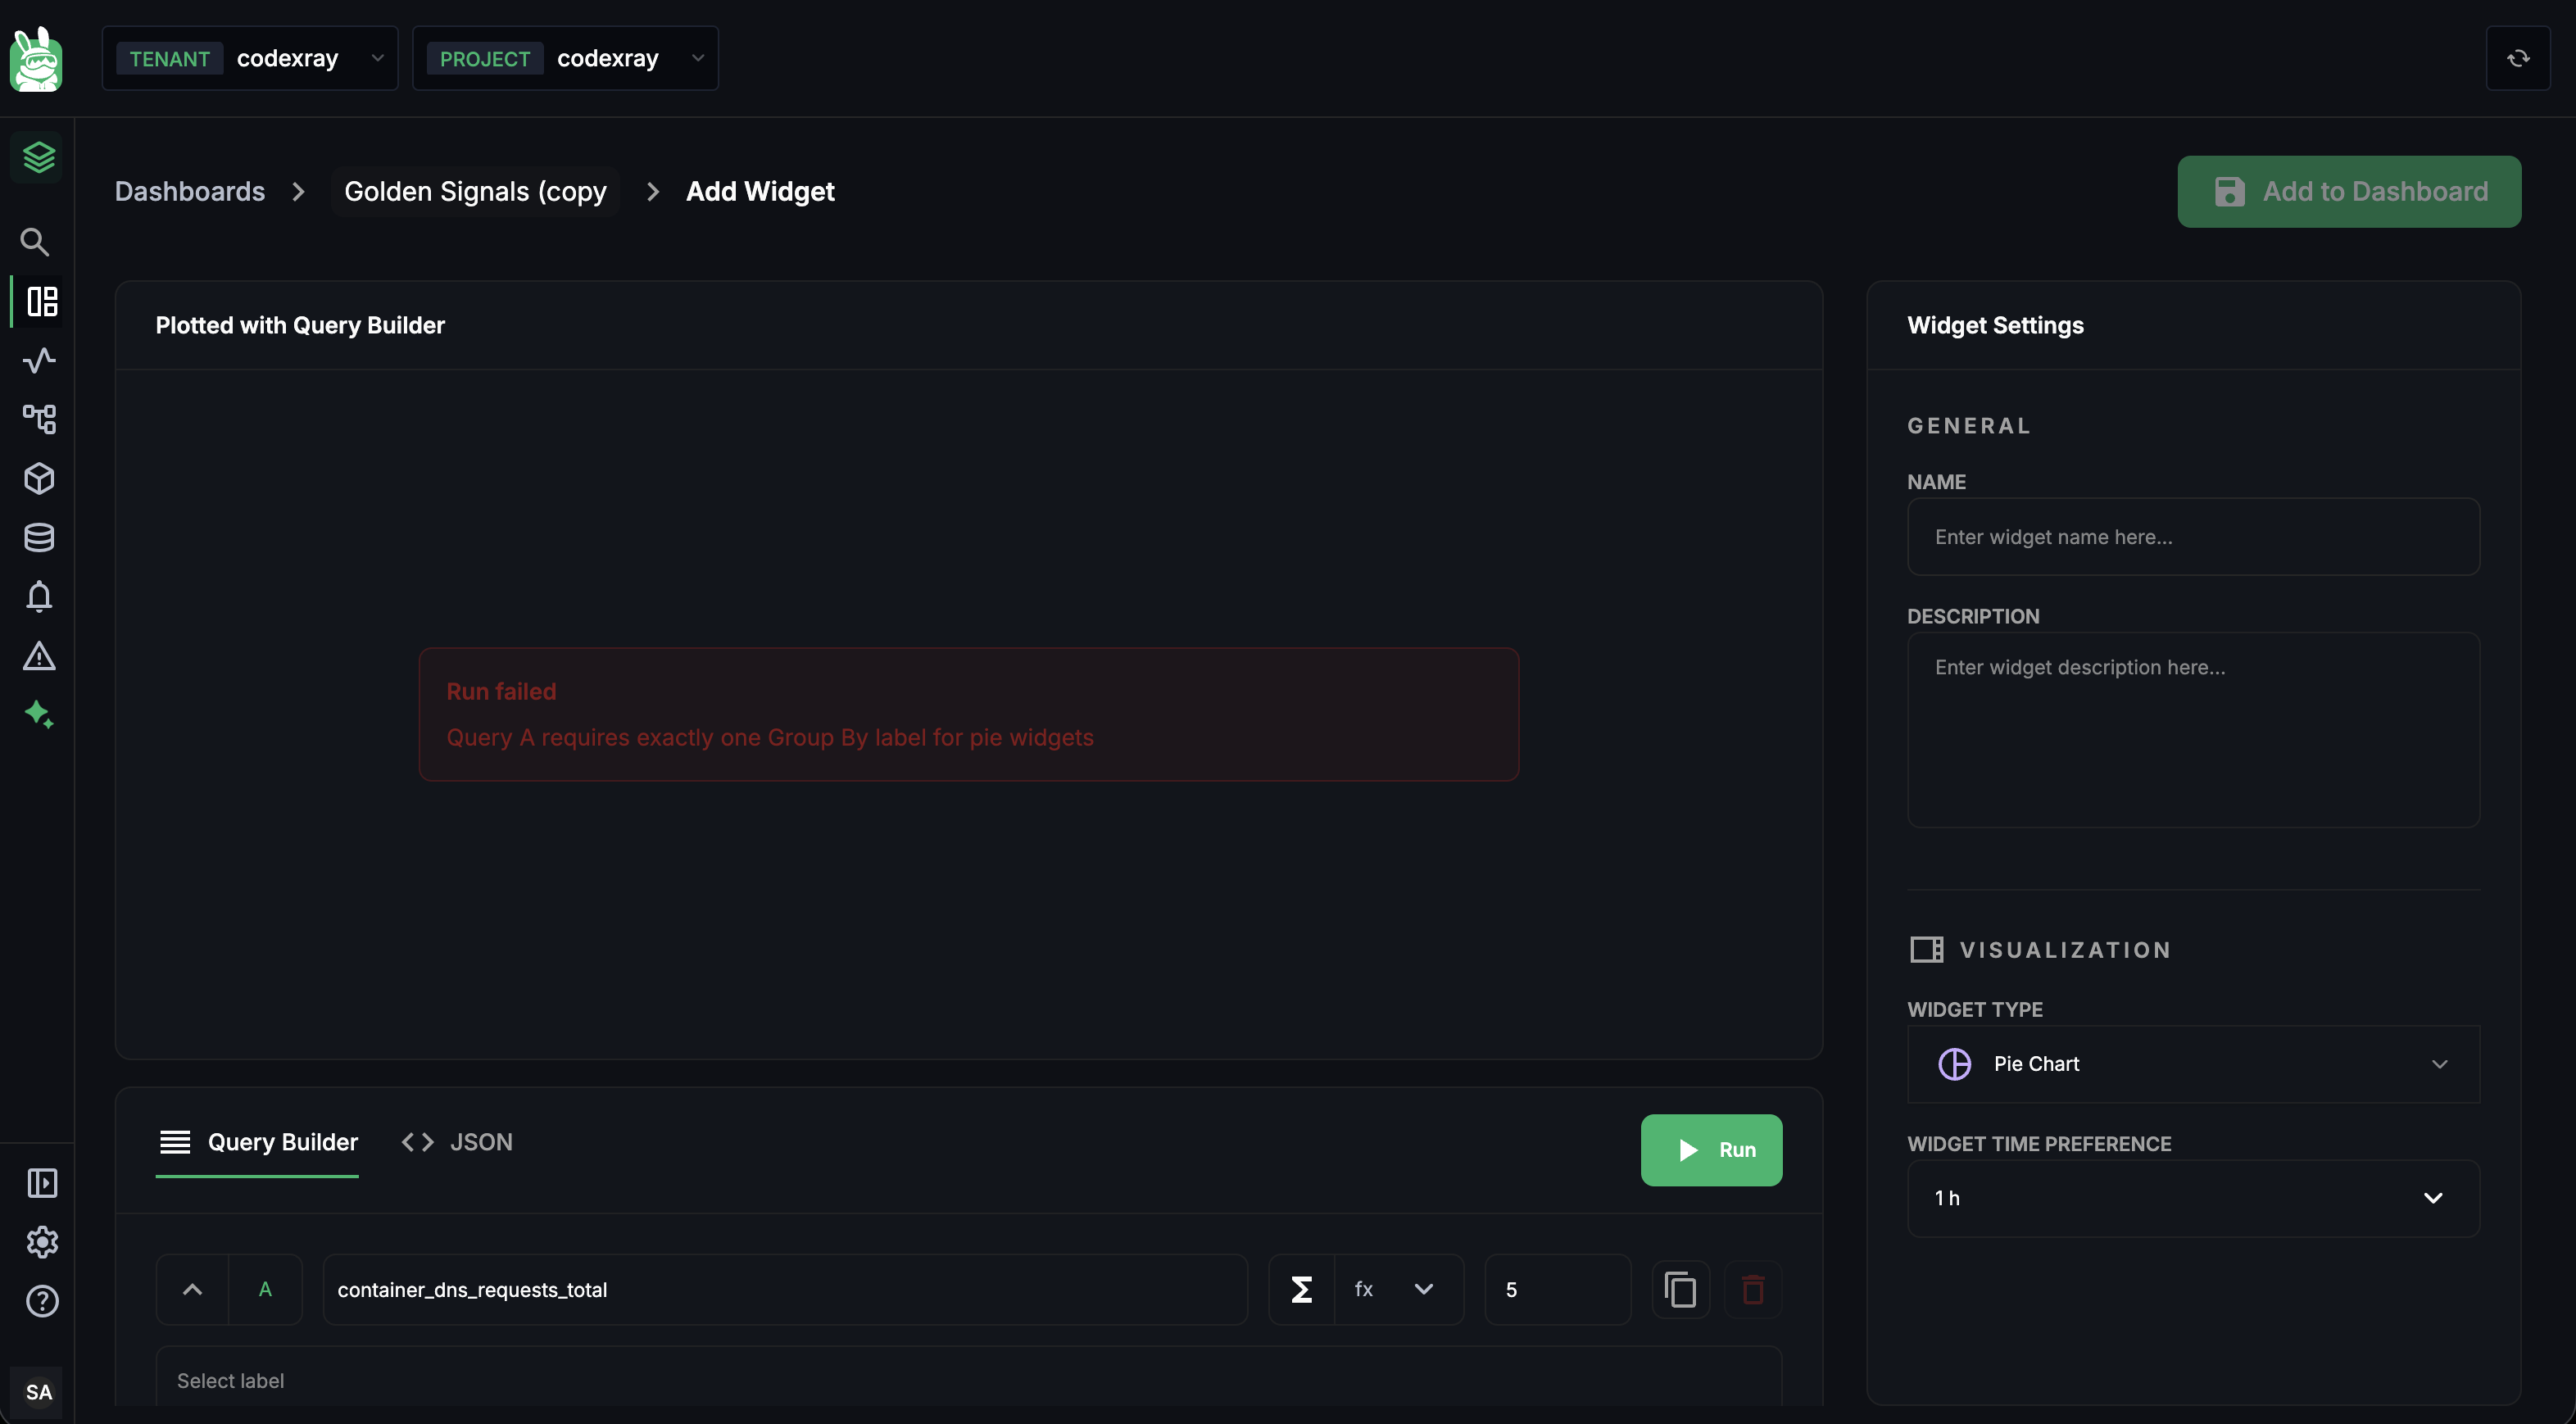
Sample fix: add a single label to the "Aggregate across time series … by" field — typically container_id, namespace, service_name, or whatever identifies the entity you want the slices to be. Don't add a second — exactly one group-by is required (any more and the chart can't decide what's a slice).
The error → fix beat is the first 25 seconds of the Power Features clip at the top of this page.
Query Value — single-series result
Query Value resolves to one number. The query has to collapse to a single series:
- No group-by, or
- A group-by where the data only has one matching label value, or
- A reducing aggregation that collapses series (e.g.
sumwith no group-by, ortopk(1))
If the query returns multiple series, the preview surfaces "Query Value requires a single-series result" and the panel renders the first series only at save time. Set the limit field on the query row to 1 as a safety net.
Table — at least one group-by + at least one column
Tables need rows (one per group) and columns (one per metric):
- Group By field at the bottom of the editor — at least 1, up to 3 group-by labels (typically
container_id+pod_name+namespace) - At least one column — each column carries its own query with its own metric and aggregation
If you try to Run without a column, the preview shows "Table requires at least one column". See Table — multi-metric rows below for the column-add flow.
Time Series — anything goes
Time Series has the loosest rules. As long as one query has a metric, it'll render. Multi-series, no-group-by, formulas, PromQL — all valid.
The Two Aggregations — Time and Space
Every Query Builder query carries two aggregations. Understanding which is which is the single biggest lever in the builder.
┌─────────────────────────────────────────────────────┐
│  Time aggregation                                   │
│  "How do I roll up each individual series over the  │
│   step window?"                                     │
│  e.g. rate / increase / avg_over_time / max_over_time│
└─────────────────────────────────────────────────────┘
                          ↓ produces one value per series, per step

┌─────────────────────────────────────────────────────┐
│  Space aggregation                                   │
│  "How do I fold multiple series into one (or N)?"   │
│  e.g. sum / avg / min / max / count / topk           │
│   grouped by container_id / namespace / …            │
└─────────────────────────────────────────────────────┘
                          ↓ produces the final series the panel draws
Time aggregations — what each one does
The "Aggregate within time series" dropdown choices, in plain English:
| Function | What it does | Use when |
|---|---|---|
rate | Per-second rate of a counter over the step window. Handles counter resets. | Counter metrics — almost always your default. |
irate | Instantaneous rate — uses just the last two samples. Spikier than rate. | Counters where you want to see micro-spikes (debugging only). |
increase | Total counter delta over the window. rate × window-seconds. | Counters where you want a total over a window (e.g. "errors in the last 5 min"). |
avg_over_time | Average of a gauge over the window. | Gauge metrics — the default for gauges. |
min_over_time | Minimum of a gauge over the window. | Worst-case dips (free disk space, available memory). |
max_over_time | Maximum of a gauge over the window. | Worst-case peaks (CPU, memory). |
last_over_time | The most recent value in the window. | Gauges where you only care about right now. |
histogram_quantile | A latency quantile from histogram buckets. | Histogram metrics. Usually easier to reach in PromQL mode. |
Space aggregations — what each one does
The "Aggregate across time series" dropdown:
| Function | What it does |
|---|---|
sum | Adds all matching series into one. Group-by partitions which series get summed. |
avg | Averages all matching series. Use for things like average CPU across pods. |
min | The minimum value across matching series at each time step. |
max | The maximum value across matching series at each time step. |
count | The count of series — not their values. Useful for "how many pods are reporting this metric". |
topk | The K series with the highest values. Combined with the limit field on the query row (typical: topk + limit 5 = top 5 noisy containers). |
The by <label> field controls grouping — sum by (container_id) gives you one series per container.
Step interval — the rollup window
The every N Minutes field next to the time aggregation is the step interval — how big a window each rollup datapoint covers. The default is 1 minute. Increase for longer time ranges; decrease for fine-grain debugging at the cost of more datapoints.
Metric Types — Counter, Gauge, Histogram
CodeXray's agents emit three Prometheus metric types. The builder needs to know which type a metric is so it can default the time aggregation correctly. Picking the wrong type is the most common reason a widget renders "NO DATA" or a flat zero.
Counter
A monotonically increasing total — resets when the container that emits it restarts. Always ends in _total. The raw value is rarely useful — you almost always want a rate or an increase.
Examples in your stack:
container_http_requests_total— HTTP requests delivered to this containercontainer_log_messages_total— log lines emittedcontainer_resources_cpu_usage_seconds_total— cumulative CPU timecontainer_net_tcp_bytes_in_total— bytes received
Default time aggregation: rate (per-second) or increase (total over window).
Gauge
A point-in-time value that can move freely in either direction. Naming has no trailing _total.
Examples:
container_resources_memory_rss_bytes— current memory in usecontainer_resources_disk_used_bytes— current disk usagecontainer_jvm_heap_used_bytes— current JVM heap
Default time aggregation: avg_over_time (for the typical "what's happening on average" chart) or last_over_time (for "what's the current value" tiles).
Histogram
A distribution of observations bucketed by upper bound. CodeXray emits histograms as a family of _bucket, _sum, and _count series. The bucket boundaries depend on the histogram — typical latency histograms are 0.001, 0.01, 0.1, 1, 10 seconds, etc.
You usually want a quantile, not the raw buckets:
histogram_quantile(0.99,
  sum by (le, container_id) (
    rate(container_http_request_duration_seconds_bucket[5m])
  )
)
That's the 99th-percentile request latency, per container, over the last 5 minutes. The Query Builder exposes histogram_quantile via the fx menu on a query row, but for anything non-trivial it's cleaner to switch to PromQL mode.
rate() a gaugeThe single biggest "this widget shows nonsense" trap. rate() is for counters. Putting rate() on container_resources_memory_rss_bytes gives you the rate of change of memory — almost never what you want. If the metric doesn't end in _total, default to a gauge aggregation.
The fx Menu — Functions and Transformations
The fx ▾ dropdown on a query row carries the per-query function library. Pick one and it wraps your metric — the live preview at the bottom of the formula bar shows the resolved expression. The most common entries:
| Function | What it does | Typical use |
|---|---|---|
rate | Per-second rate of a counter | Counter metrics — the default |
irate | Instantaneous rate (last two samples) | Counters, micro-spike debugging |
increase | Total counter delta over the window | "How many errors in the last 5 min?" |
avg_over_time | Window average of a gauge | Gauge metrics — the default |
min_over_time / max_over_time | Worst-case dips / peaks of a gauge | Gauge metrics — capacity dashboards |
last_over_time | Latest value | Gauge tile widgets |
histogram_quantile | A quantile from histogram buckets | Latency p50/p95/p99 |
round | Round to the nearest integer | Cleaning up table cells and number tiles |
abs | Absolute value | When deltas swing both ways |
log2, log10 | Log scale | Spreading wide-range data visually |
clamp_min, clamp_max | Floor / ceiling values | Cleaning up division-by-zero spikes |
The same expression can chain multiple fx wraps — the builder applies them in order. For deeper composition, use PromQL mode.
Panel-by-Panel Deep Dive
Each panel type has its own quirks beyond the universal rules. Here's the operator's view of each.
Time Series — trends
Time Series is the workhorse. Any combination of queries, group-by, formulas, and PromQL is valid.
Settings to know:
| Setting | Where | Notes |
|---|---|---|
| Visualisation type | Right panel after Add to Dashboard | line / area / bar / stacked |
| Legend | Right panel | Toggle on/off; long legends collapse below the chart |
| Axes labels | Right panel | Set y and x axis labels |
| Multi-series limit | Query row limit + space-aggregation topk | 5 max for time series top-K — narrow further to keep the chart readable |
A typical "top 5 by container" setup:
- Metric:
container_http_requests_total - fx:
rate - Time aggregation:
rate - Space aggregation:
topk, bycontainer_id - Limit:
5
Query Value — single KPI
Query Value renders one number, optionally with a small sparkline beneath it.
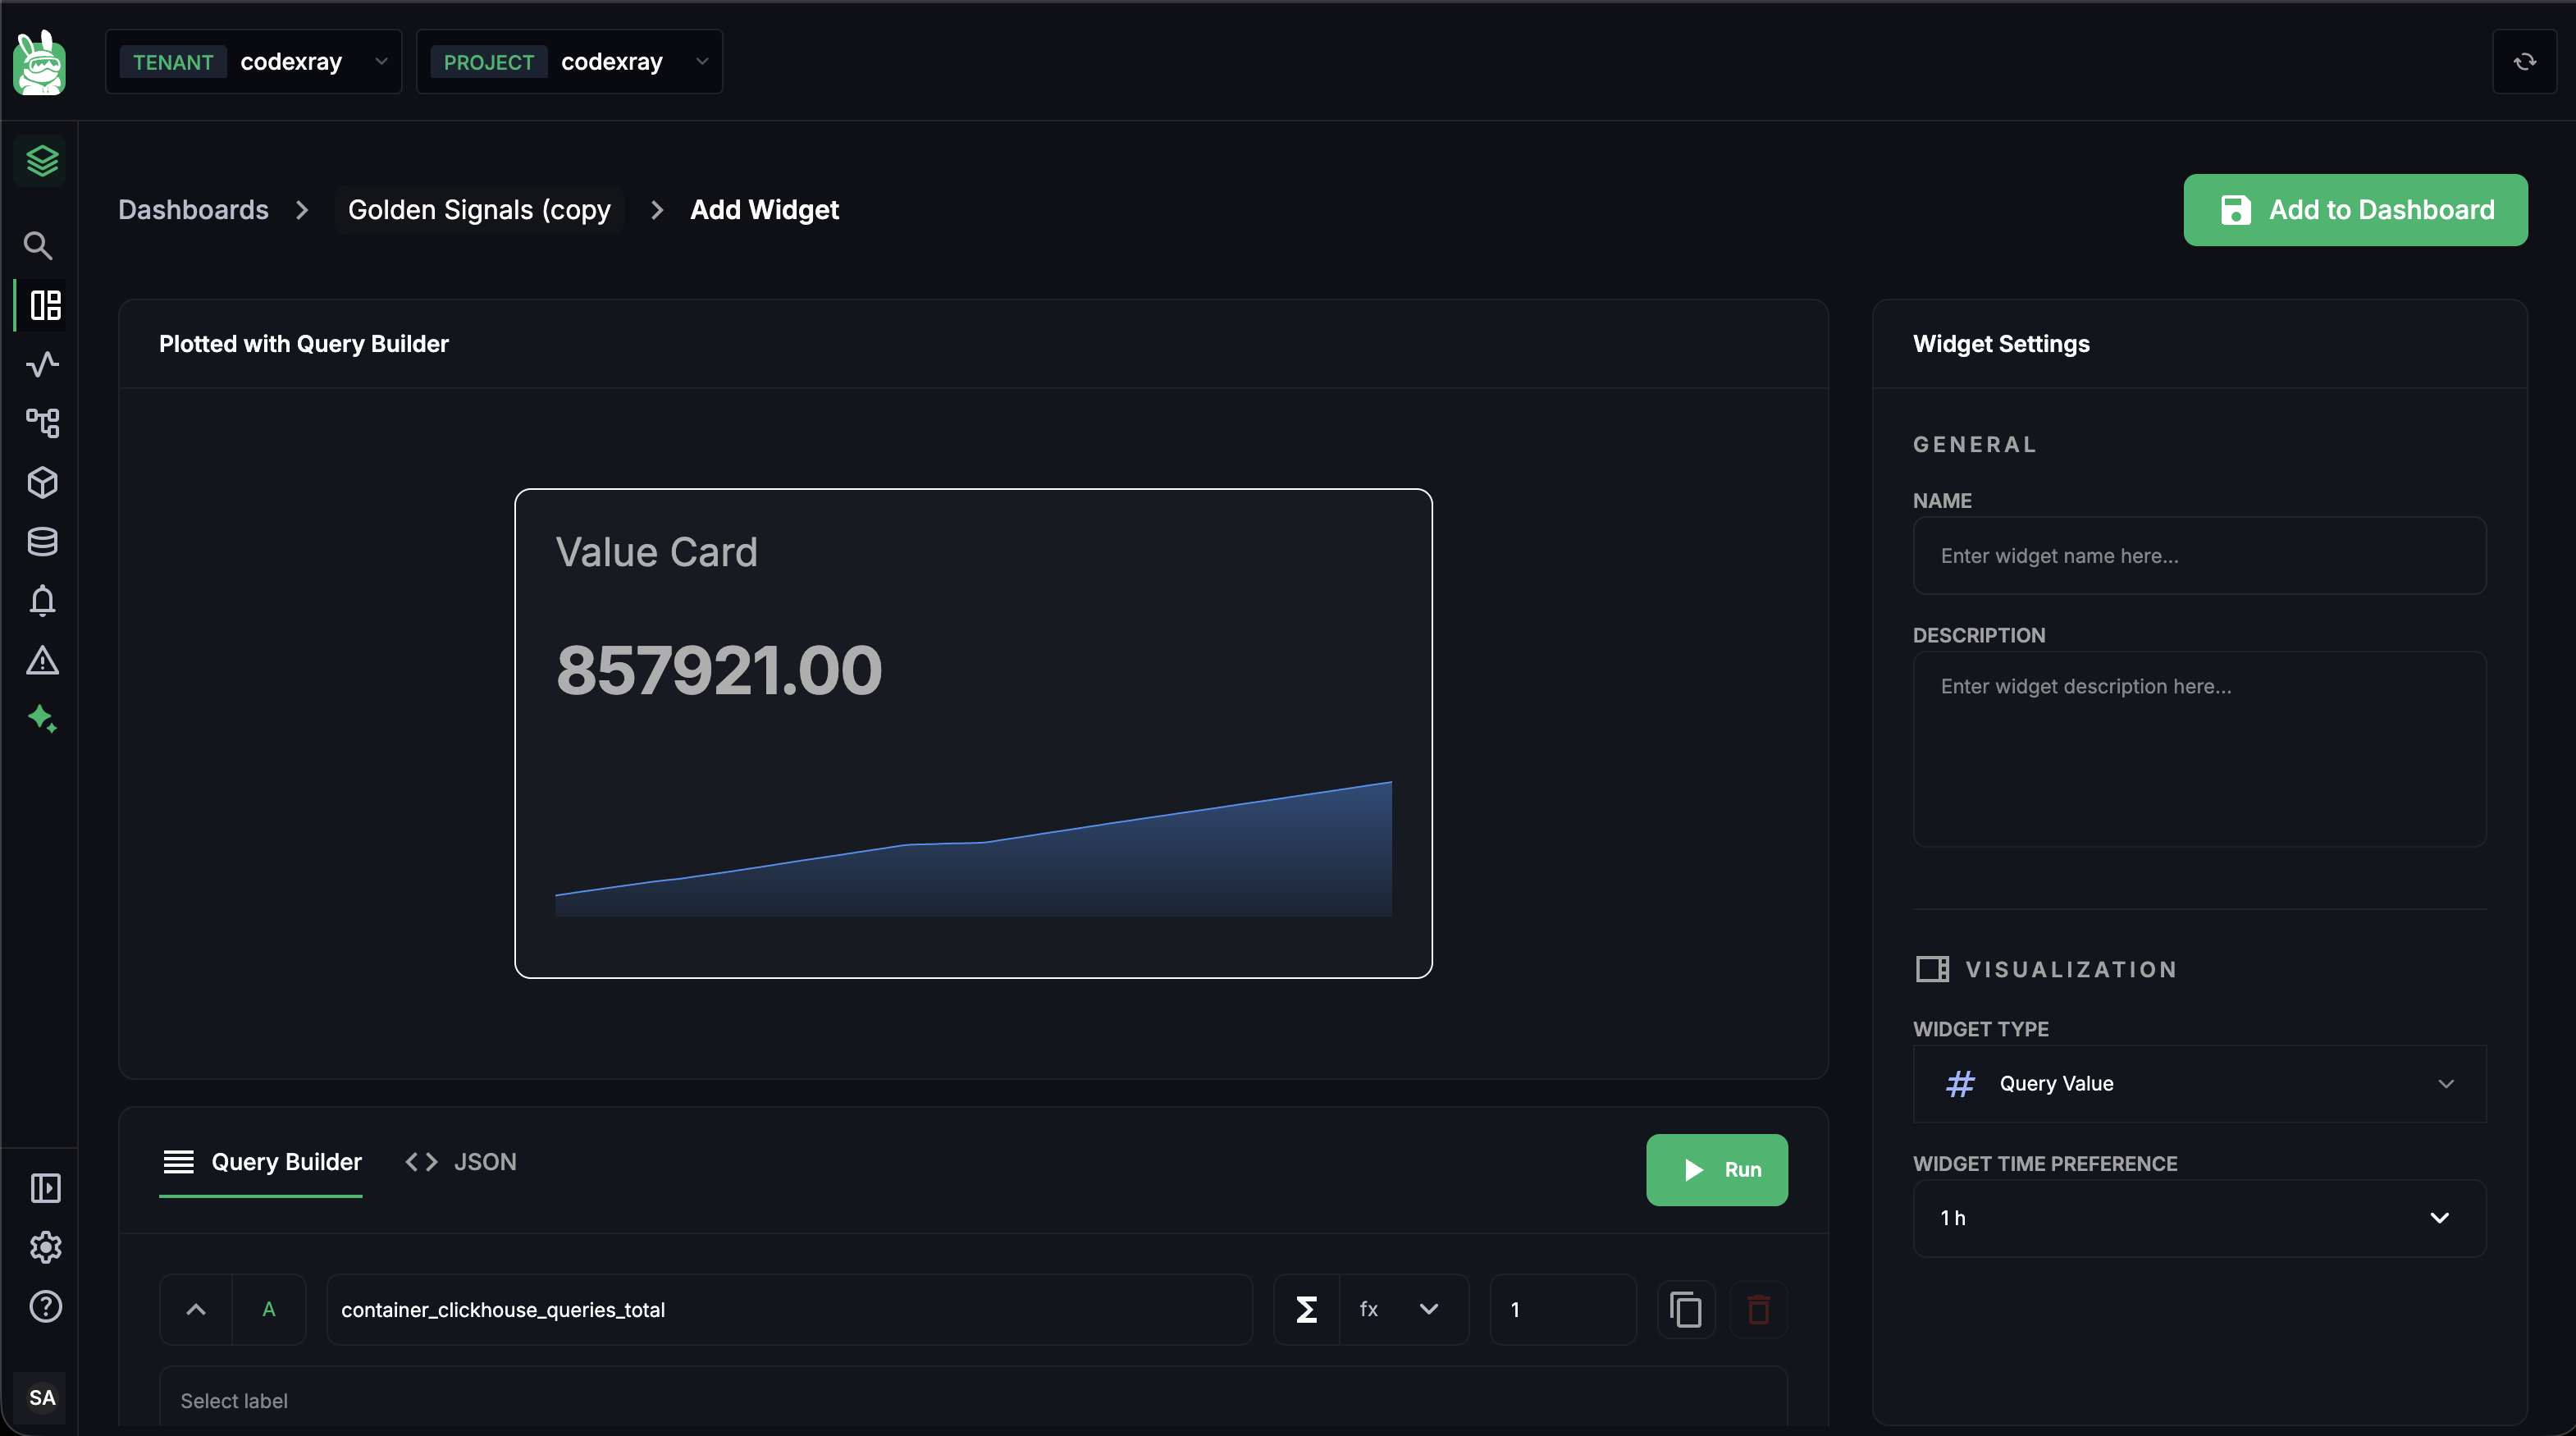
Settings:
| Setting | Where | Notes |
|---|---|---|
| Limit | Query row | Set to 1 |
| Group-by | Query row's "Aggregate across by" | Leave empty, or use a reducing aggregation that collapses to 1 |
| Unit | Right panel | Suffix shown after the value (ms, %, req/s) |
| Comparison | Right panel | none or previous_period — shows ± delta versus the prior window |
Required: exactly one query, single-series result. If your raw query returns multiple series, add sum (no group-by) or topk(1) to collapse it.
Table — multi-metric rows
Tables are the densest panel — one row per entity, one column per metric.
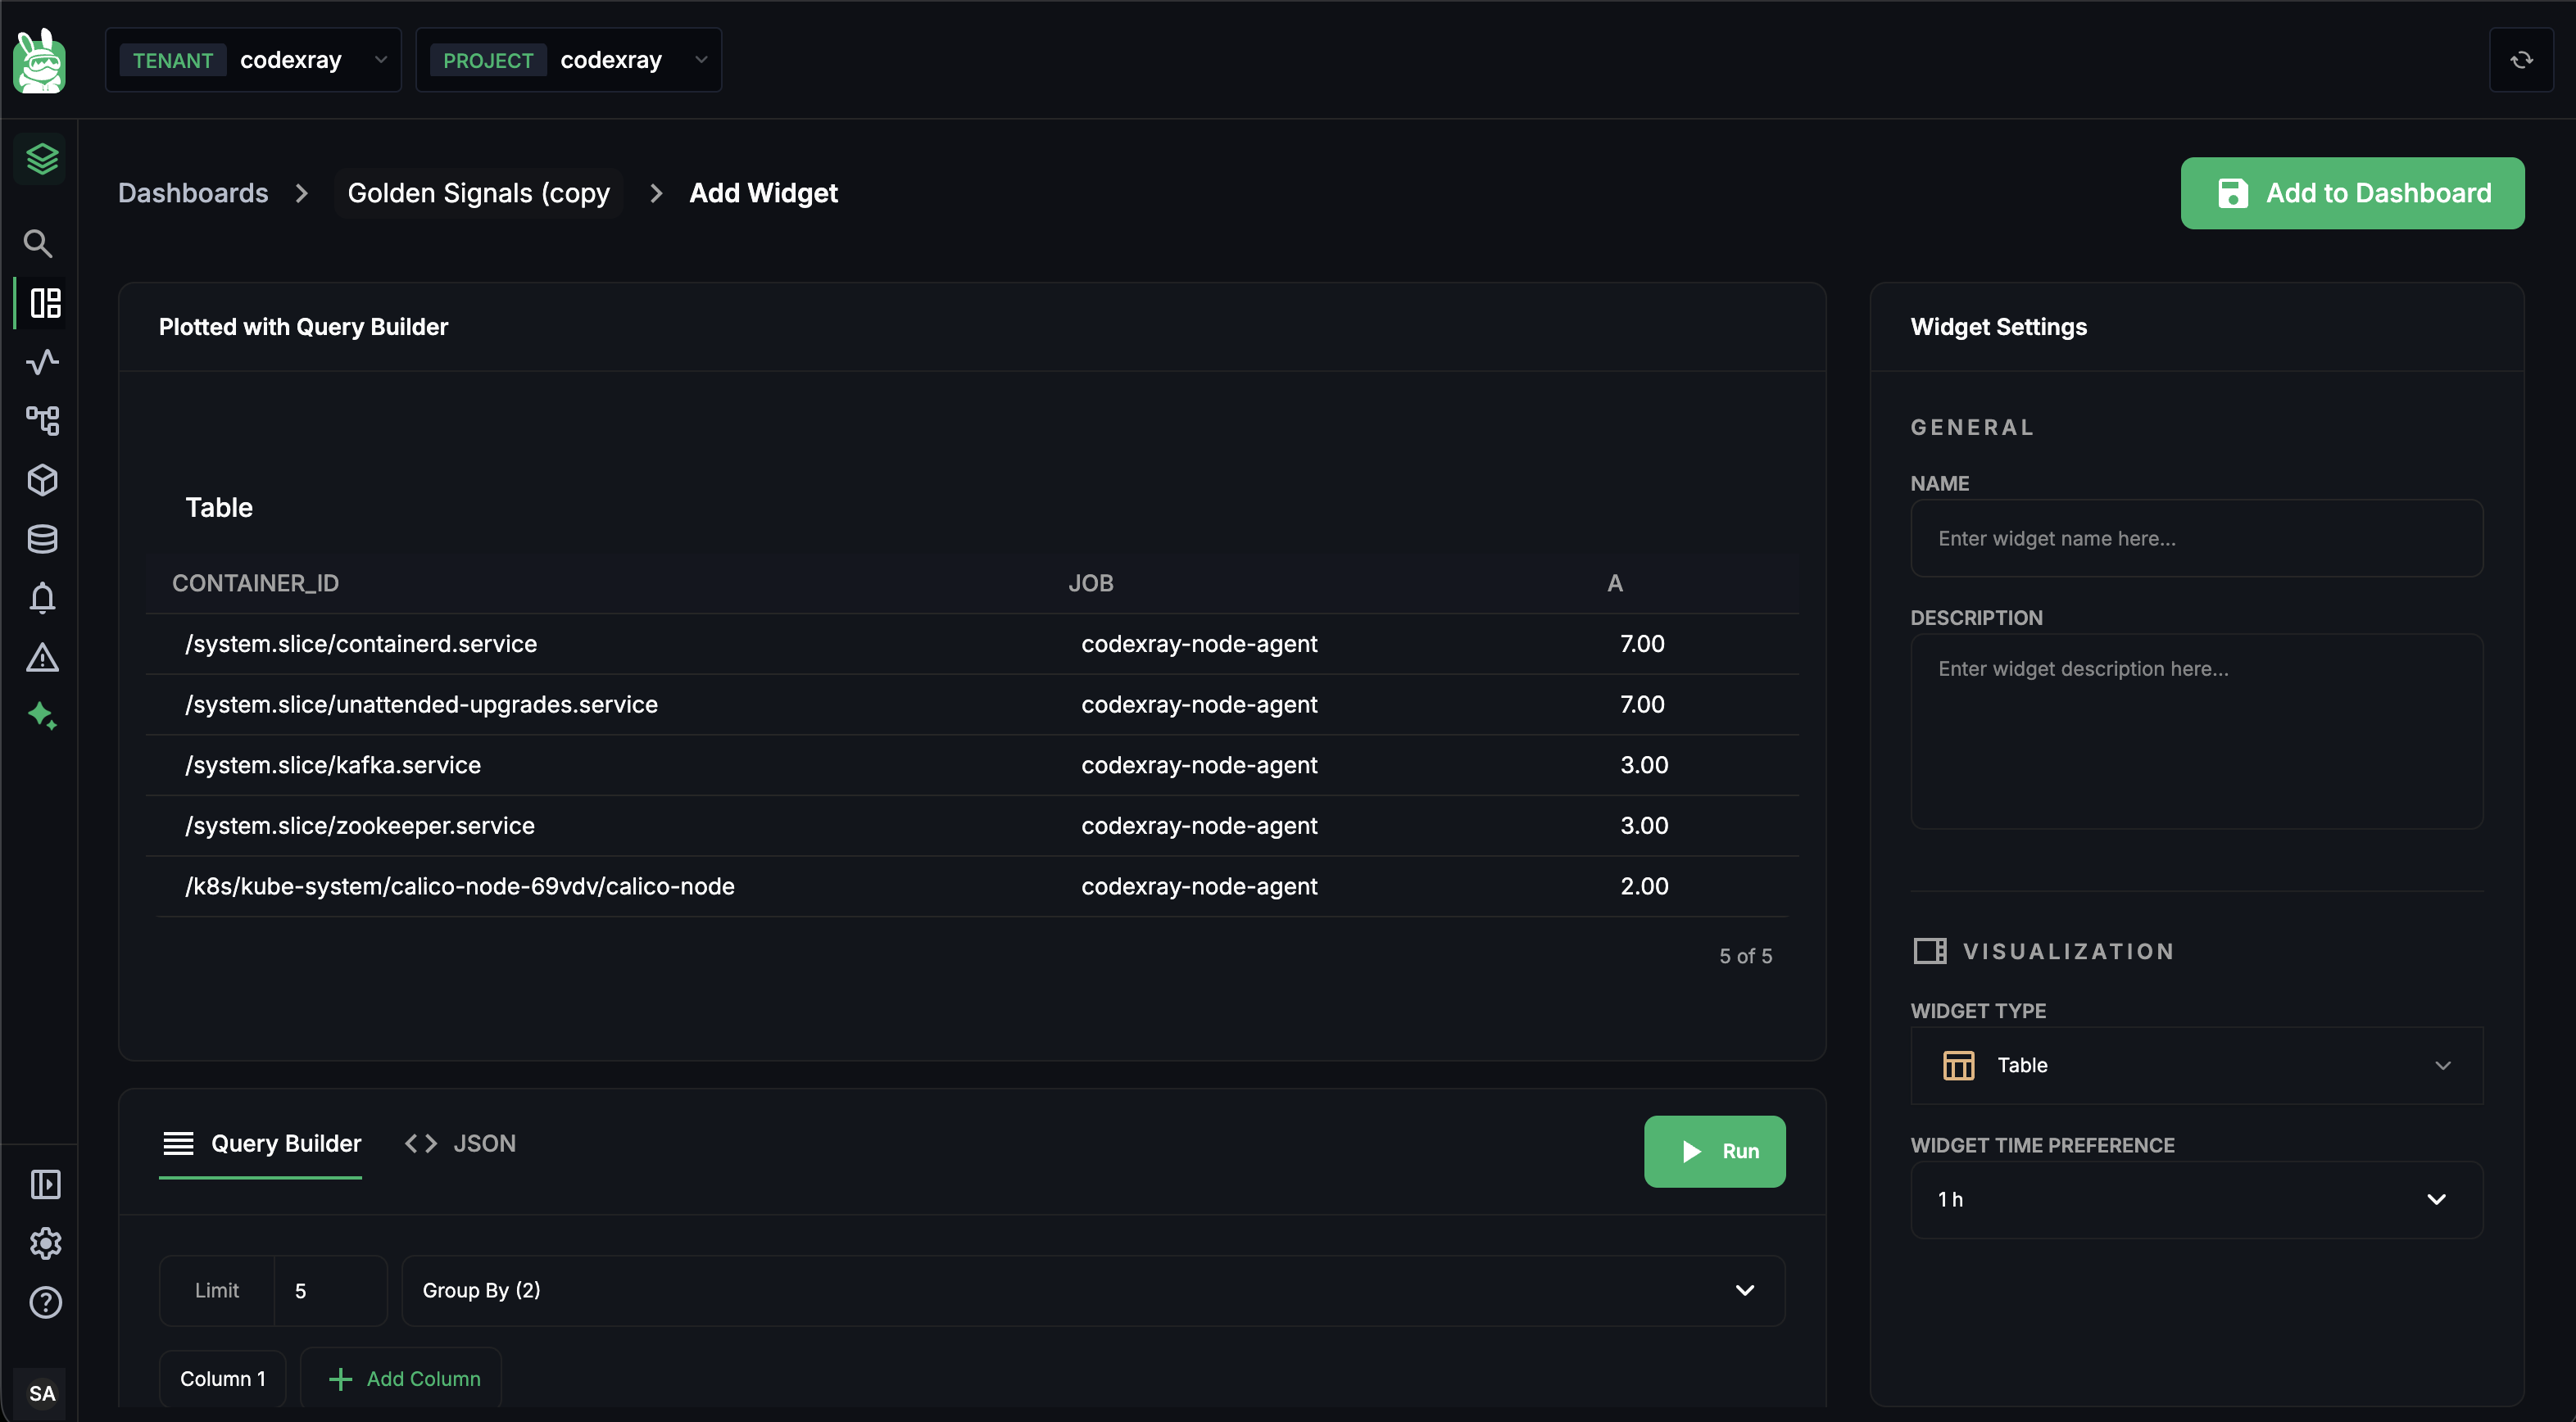
Where the bottom controls live:
| Control | What it does |
|---|---|
| Limit | Max rows in the table (default 5; up to 100 server-side) |
| Group By (N) | The labels that define each row. At least 1, up to 3. Each value combination = one row. |
| Column N | One query per column. Click + Add Column to add another. Up to 5 columns. |
Each column gets its own metric, fx, time aggregation, and space aggregation — that's how a single table can show CPU rate, memory RSS, and restart count in three side-by-side columns. The column name (top of each column's editor) is what shows in the column header.
Cell formatting: numeric values are rendered to 2 decimal places by default. Use fx → round on the column's query for cleaner integer cells.
Pie Chart — distribution
Pie shows share — what fraction of the whole each label value contributes.
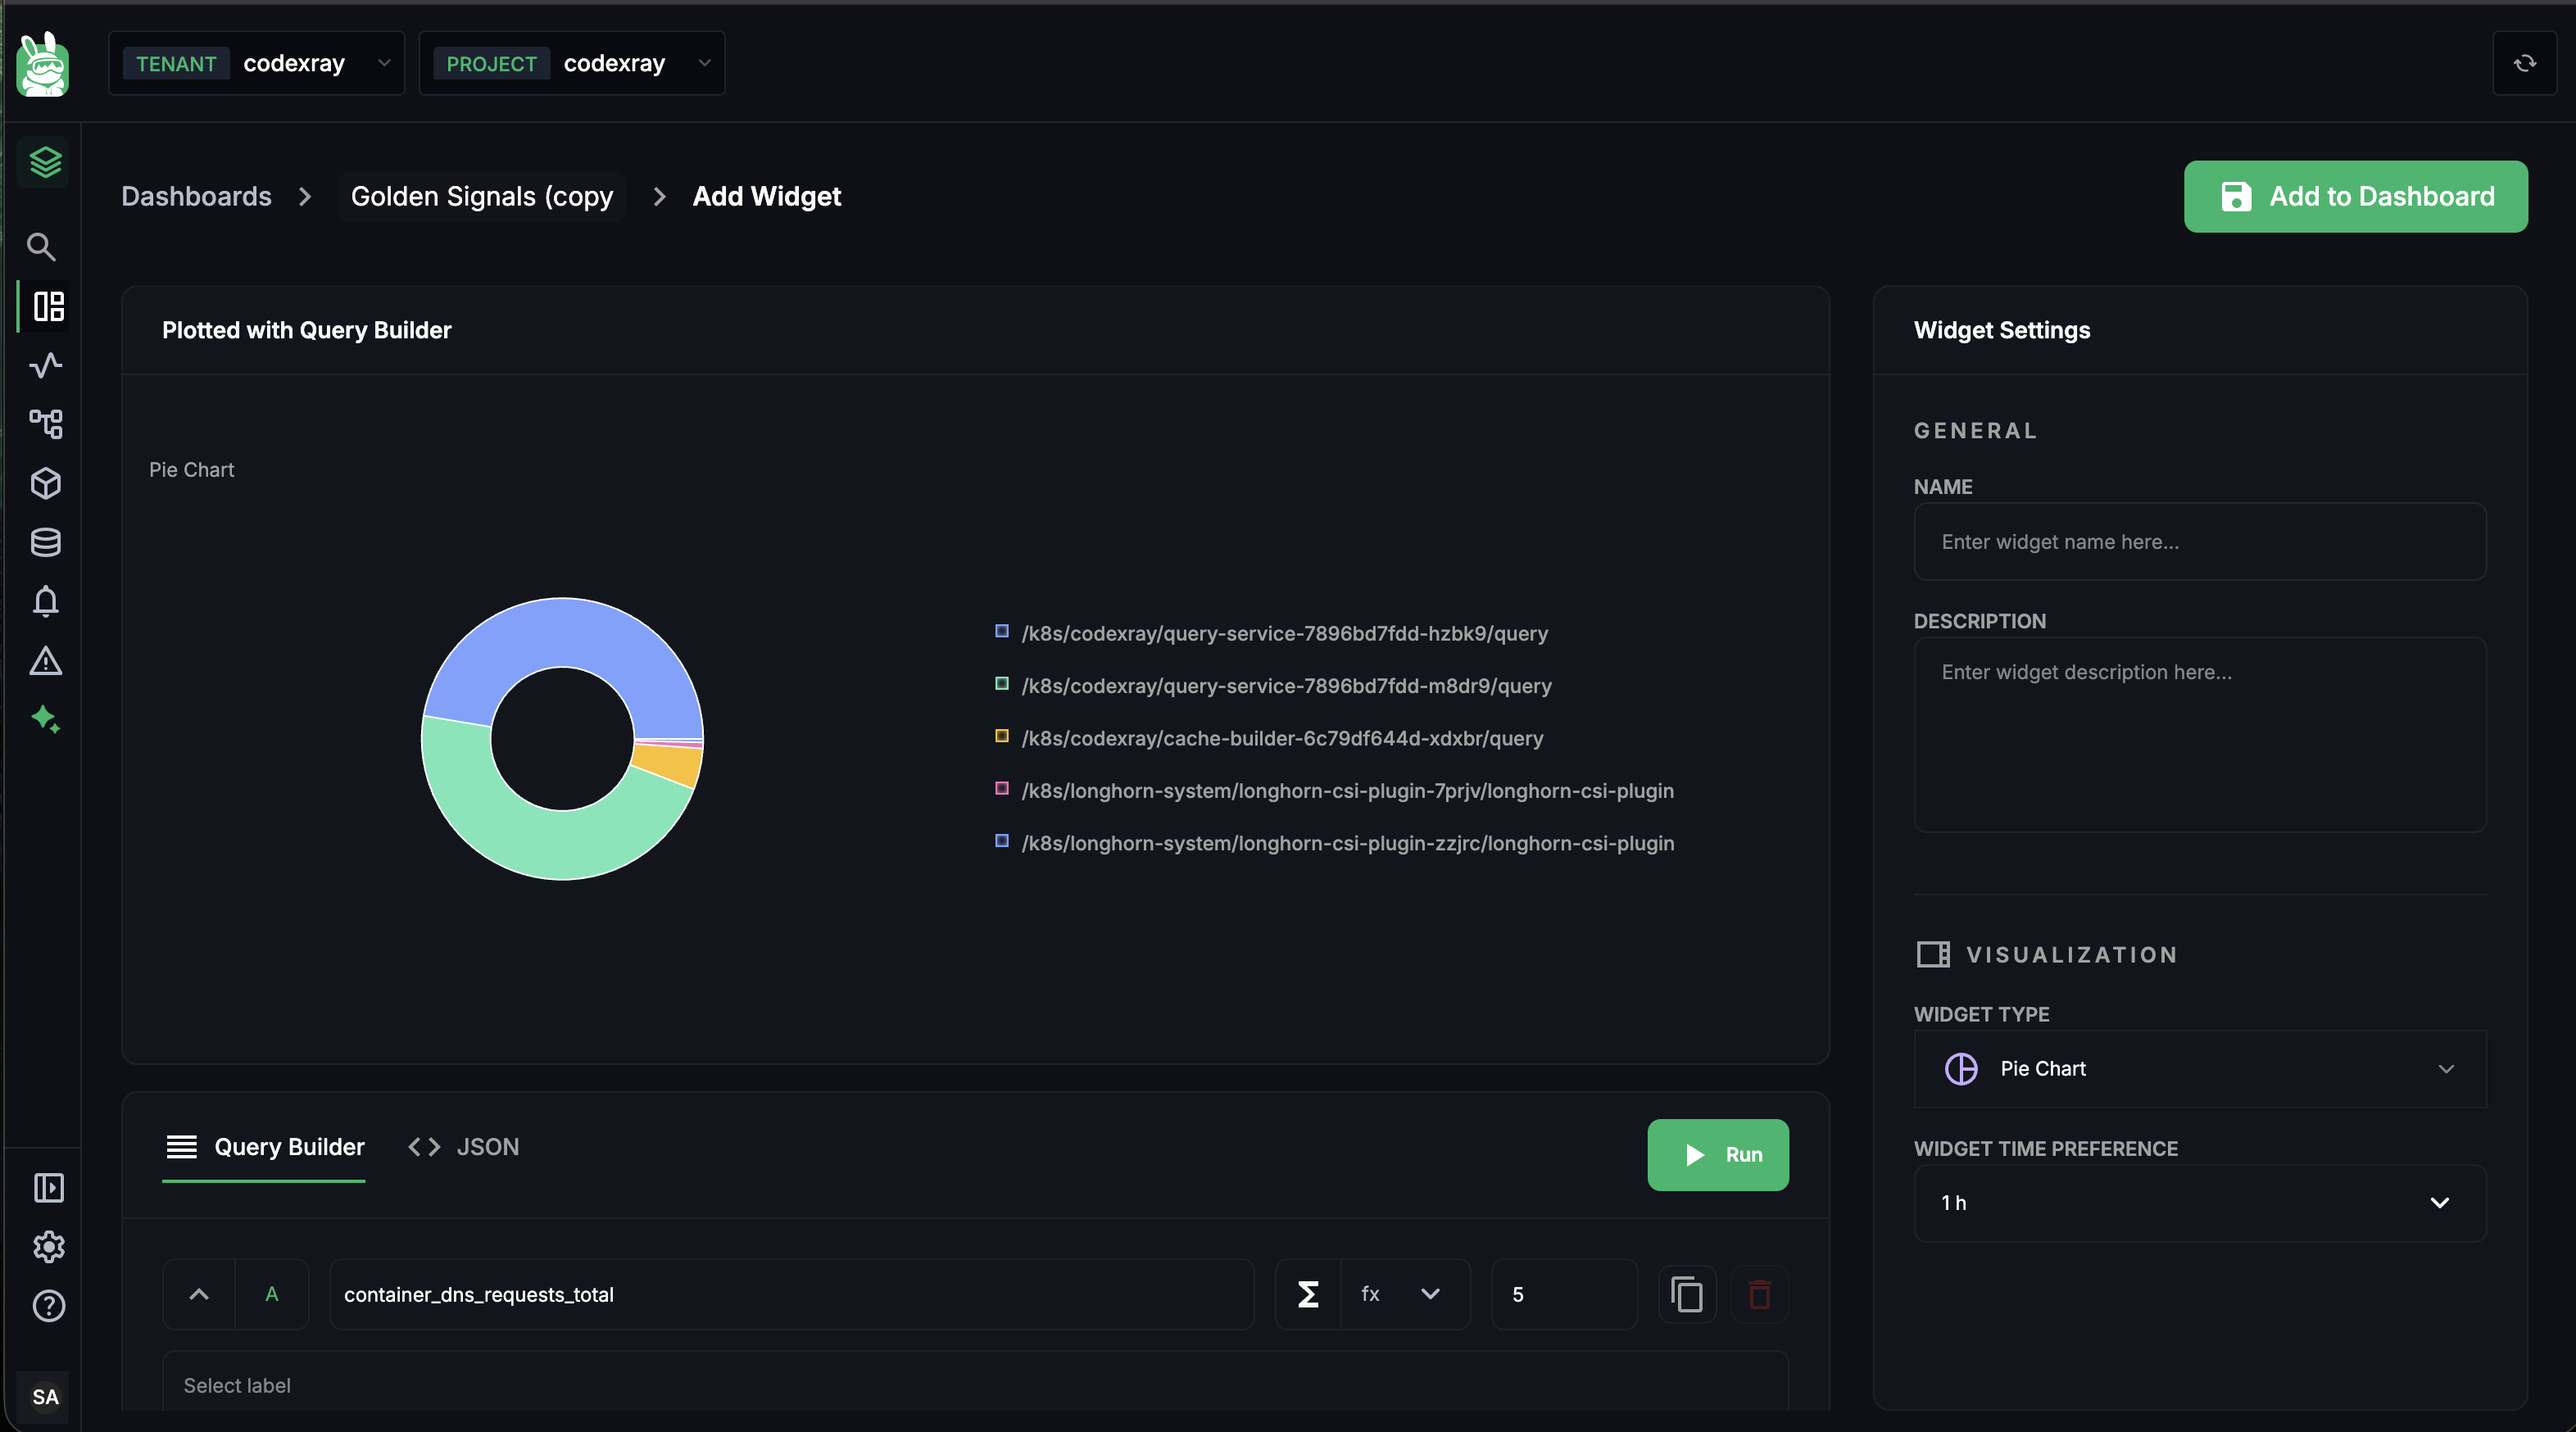
The only rule beyond the universal ones is the exactly one group-by rule (covered above). Settings to know:
| Setting | Where | Notes |
|---|---|---|
| Group By | Query row's "Aggregate across by" | Exactly 1 label required. |
| Limit | Query row | Number of slices — top-K by value. 5–7 is the readable sweet spot. |
| Colour palette | Built-in | 4 colours rotated automatically; not currently configurable. |
Formulas
Add a second query (B) by clicking + below the last query row, and a Formula bar appears at the bottom of the editor.
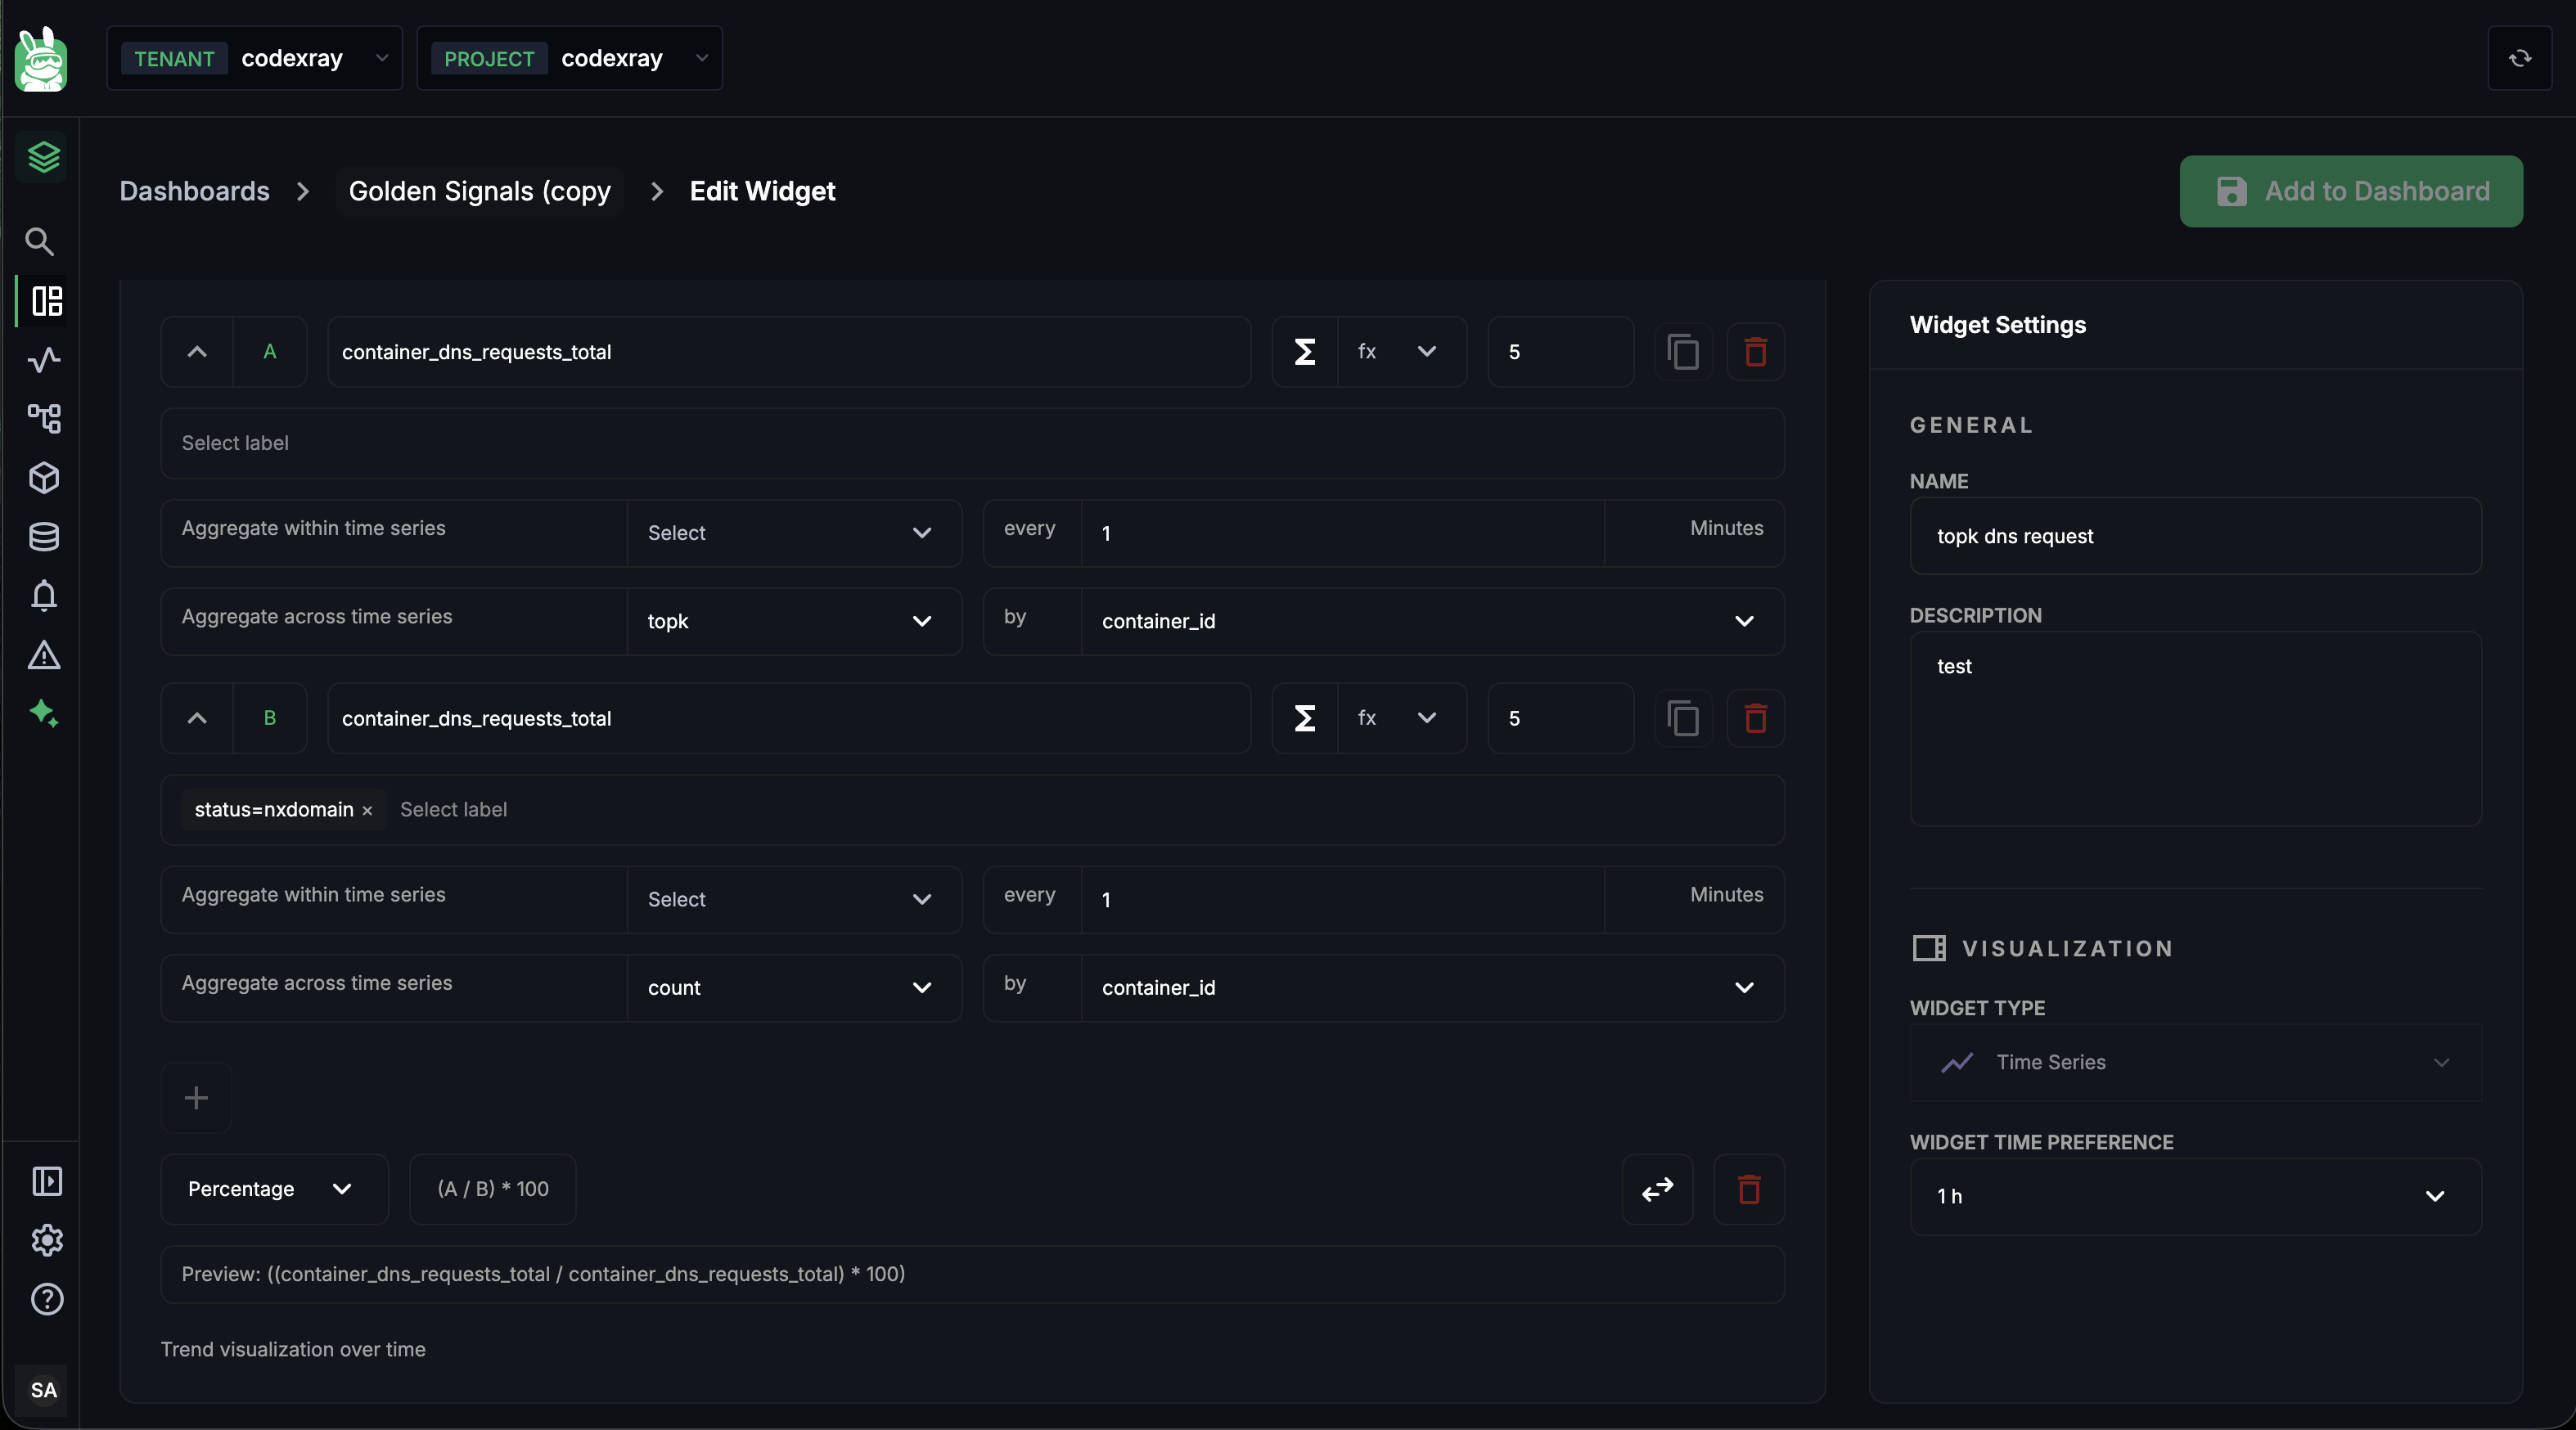
The template dropdown — seven one-click formulas
The leftmost control on the Formula bar is a template picker. Pick one and the expression field is filled in for you against your two queries (A and B). You can edit the expression afterwards.
| Template | Expression it inserts | Swap available | When to reach for it |
|---|---|---|---|
| Sum | A + B | — | "Total across two streams" — HTTP + gRPC traffic, reads + writes |
| Difference | A − B | ✓ | "Gap between two numbers" — allocated minus consumed, capacity minus usage |
| Ratio | A / B | ✓ | "Per-unit" metrics — average latency per request, errors per second |
| Multiply | A × B | — | "Combined scaling" — requests × cost-per-request, sessions × avg-duration |
| Percentage | (A / B) × 100 | ✓ | A as a percentage of B — 5xx errors / total, GC time / wall time |
| Average | (A + B) / 2 | ✓ | Mean of two metrics — smoothing two probes, blending primary and secondary measurements |
| Percent Change | ((A − B) / B) × 100 | ✓ | Growth rate — current period vs prior period |
The swap icon on swappable templates flips A and B in the expression — useful when the queries are in the wrong order and you don't want to re-author them.
Custom expressions
You don't have to start from a template. The expression field accepts any free-text math using the query letters and the four basic operators:
| Operator | Meaning |
|---|---|
+ | Add |
− | Subtract |
* | Multiply |
/ | Divide |
Plus parentheses and numeric literals. Example custom expressions you can type:
A / (A + B)— A's share of A and B combined(A - B) / B— relative change without the× 100percentage scalingA * 1000— unit conversion (e.g. seconds → milliseconds)
Other Formula bar controls
| Control | What it does |
|---|---|
| Swap icon (on swappable templates) | Reverses A and B in the expression — turns A / B into B / A |
| Delete icon | Removes the formula row. The underlying queries stay in the editor. |
| Live preview | Below the bar, shows the formula resolved with your real metric names |
Limits
- Up to 2 metrics referenced per formula (the queries
AandB) - Up to 1 formula per widget
- Time-series widgets render the formula as a third line on the chart by default; Query Value widgets render it as the displayed number
Use formulas any time the answer is "X compared to Y" — ratios, percentages, deltas, growth rates, blended averages.
Running, Saving, and Layout
The widget editor uses two buttons:
| Button | What it does |
|---|---|
| Run | Executes the query in the current mode and updates the preview. No changes are persisted. Errors land here. |
| Add to Dashboard | Persists the widget and returns to the dashboard in Edit mode (you still need to hit the dashboard's Save button to commit). |
The flow for adding a brand-new widget end-to-end:
- + Add widget on the dashboard → pick a panel type from the side panel
- Set name, type, time preference in the right panel
- Build the query in the Query Builder (or paste JSON / write PromQL)
- Run — confirm the preview shows what you expect, fix any inline errors
- Add to Dashboard — returns to the dashboard with the new widget auto-placed at the bottom of the grid
- (Optional) Drag/resize the new widget into position
- Save on the dashboard — the version bumps, everyone with view access sees it
Step 5's auto-placement uses the layout engine described in Managing Dashboards — Drag-resize layout.
Editing an Existing Widget
From a dashboard in Edit mode, click a widget's kebab menu (⋮) → Edit. The editor opens in Edit Widget mode (breadcrumb says so) with all current values pre-filled. The flow is identical — change, Run, Add to Dashboard (the button keeps that label even when you're editing) — then Save on the dashboard.
To remove a widget instead, click ⋮ → Delete in Edit mode. It's gone on the next dashboard Save. There is no undo, but Cancel before Save discards the deletion.
Troubleshooting Common Errors
| Error in the preview | What it means | Fix |
|---|---|---|
| "Query A requires exactly one Group By label for pie widgets" | Pie chart with no group-by, or with two+ group-by labels | Add a single label in "Aggregate across by" |
| "Query Value requires a single-series result" | Query returns multiple series | Set limit to 1, or add sum with no group-by |
| "Table requires at least one column" | No columns configured | Click + Add Column at the bottom of the editor |
| "Query A requires a metric" | Empty metric name field | Type a metric into the field or delete the empty row |
| "NO DATA" (not an error — the preview just renders empty) | The query is valid but the metric has no data in your environment | Verify the metric exists by typing in the autocomplete; check the time range covers when data was collected |
"Filter on label X is not allowed" | You used one of the blocked filter labels | Use a different label or remove the filter |
| "Maximum 5 filters per query" | More than 5 filter chips on one query row | Remove a chip, or split the query into A + B |
Next Steps
- Custom Dashboards — Overview — concepts, the panel/query-mode matrix, every limit in one table
- Managing Dashboards — the list view, the create dialog, view/edit modes, drag-resize layout, bulk JSON import
- Node Agent Metrics — the authoritative list of metric names emitted by the Node Agent (the most common source for custom dashboards)
- Cluster Agent Metrics — same, for the Cluster Agent