Performance & Page Details
The Performance tab answers "how fast is this application, and for whom?" — broken down by browser, device, and page. From it you can drill into any single page.
The Performance tab
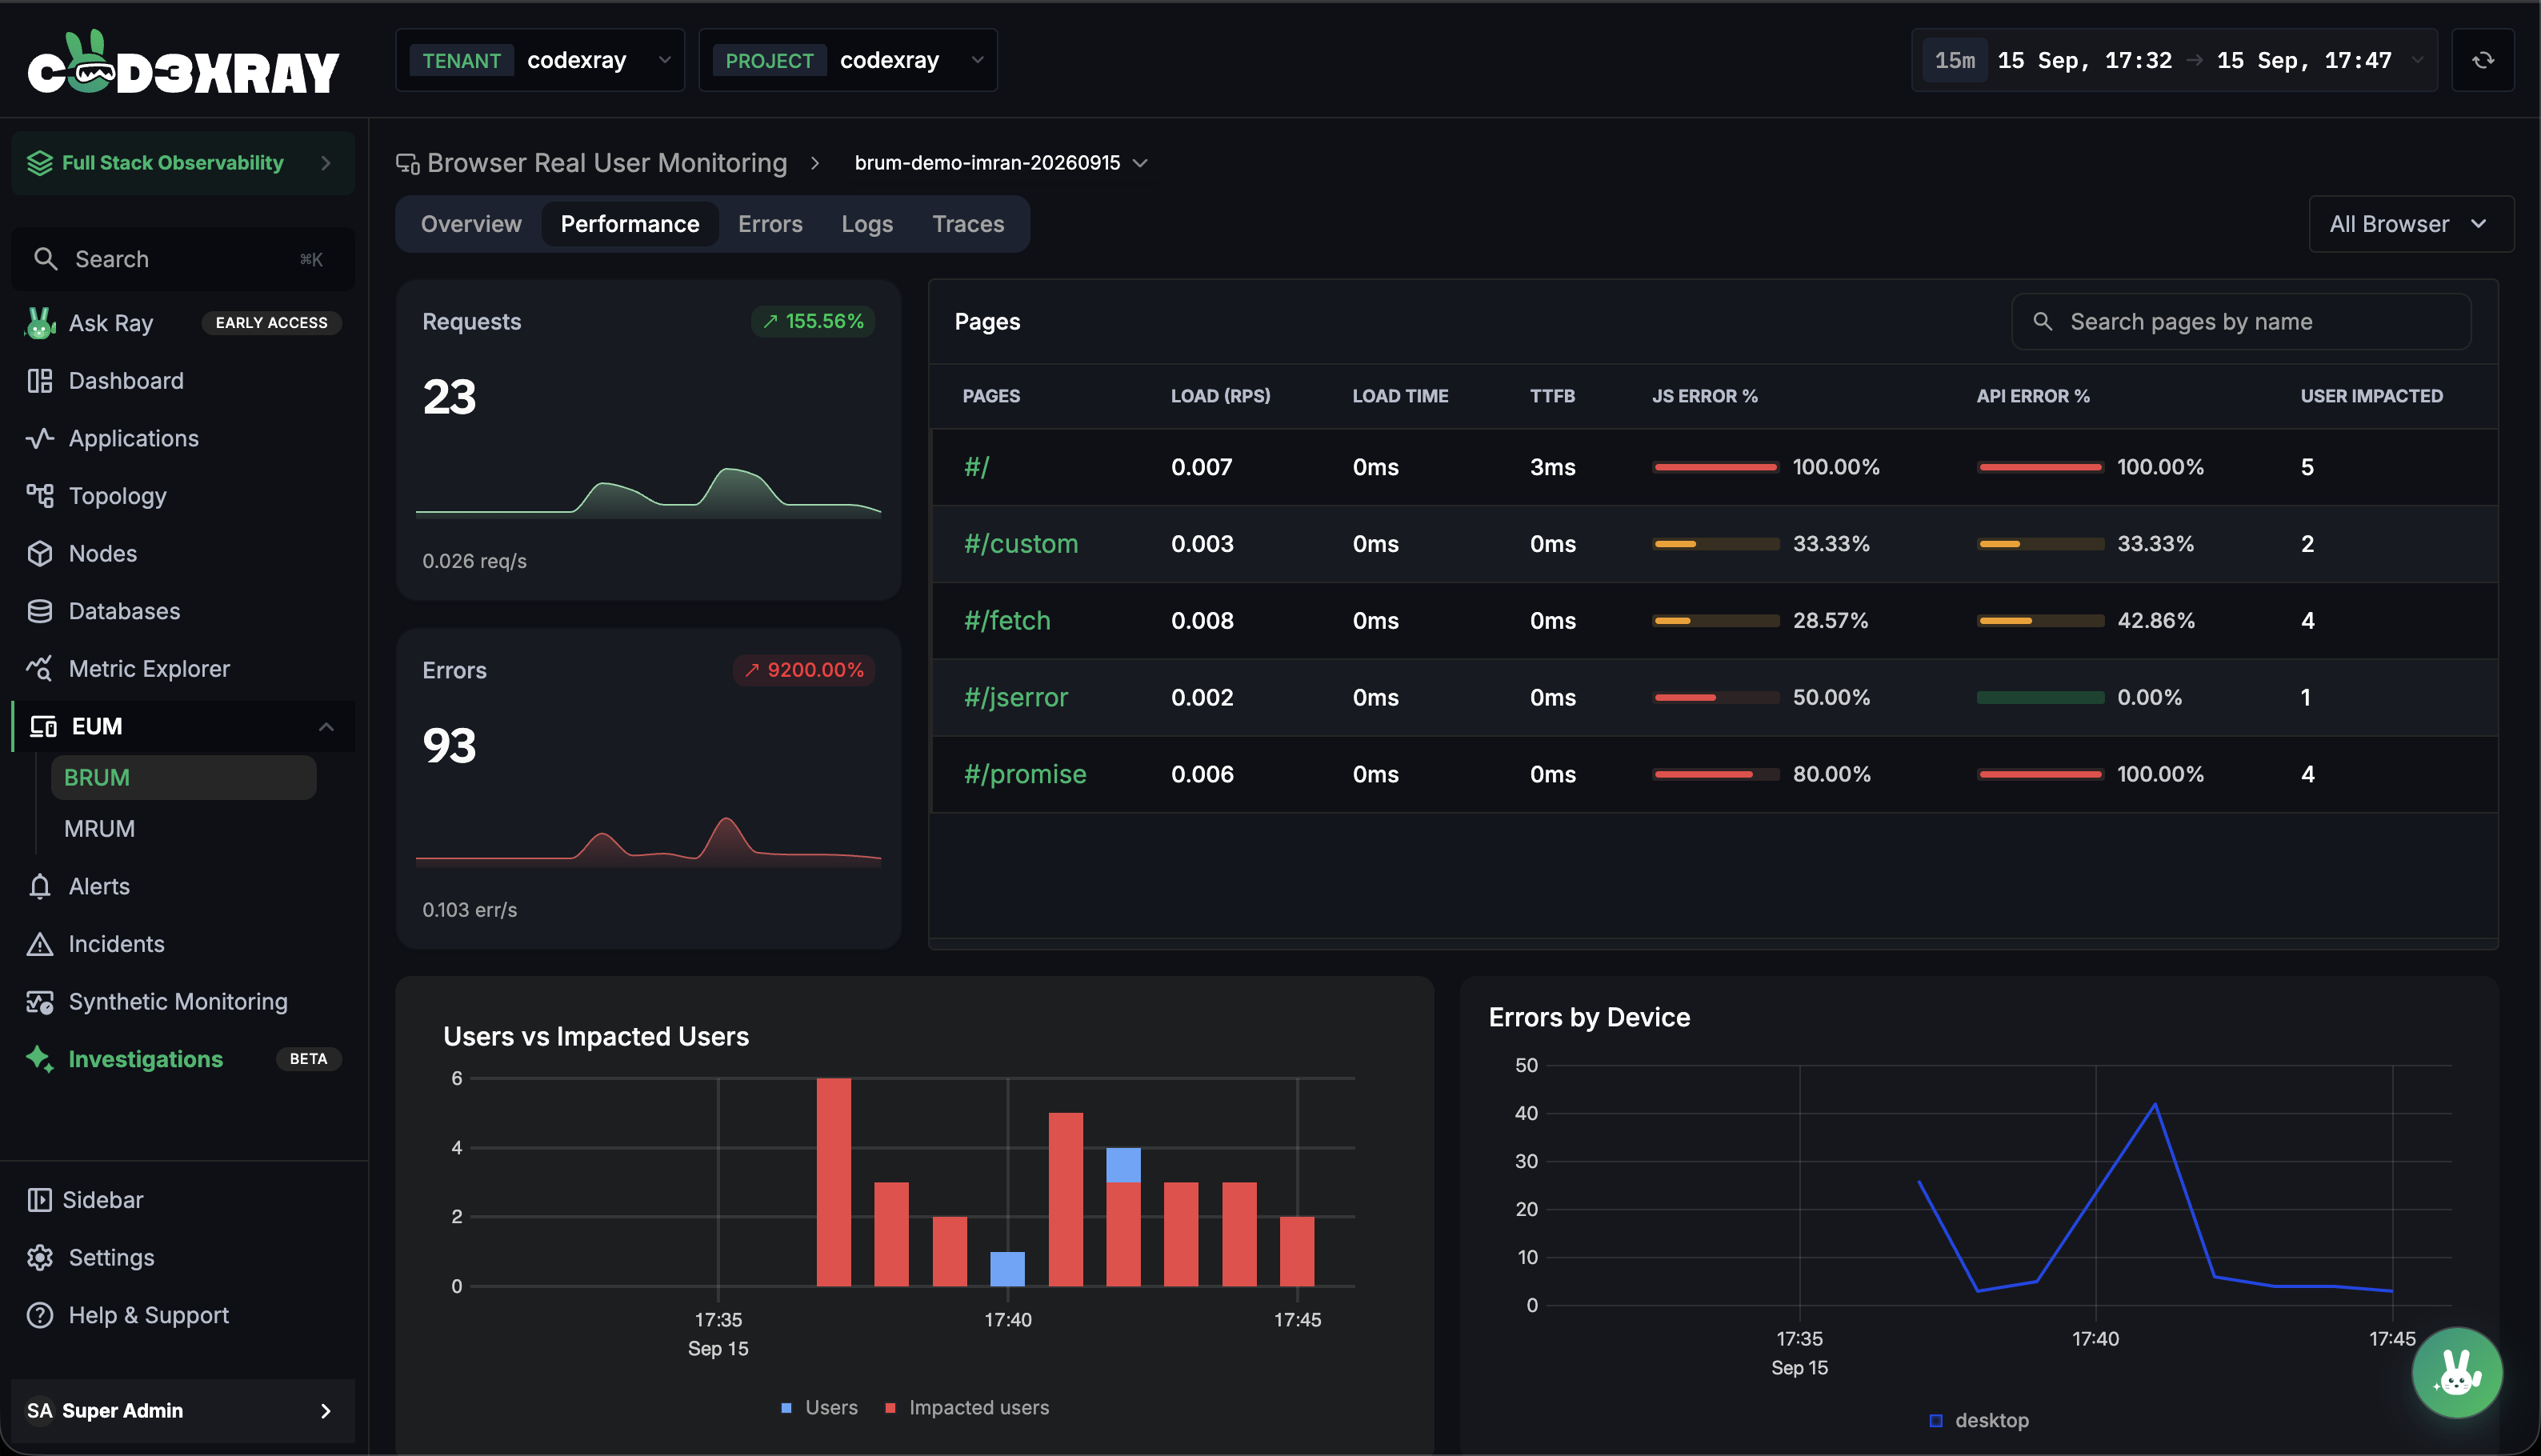
Request and error rates
Two cards head the tab — Requests and Errors — each with a trend sparkline and a per-second rate underneath (e.g. req/s and err/s).
The browser filter
A browser filter — labelled All Browser — sits on the tab row. Pick one or more browsers and everything on the screen narrows to them. Picking Chrome covers every Chrome version, not one exact build.
Devices
Device charts break load time, response time, and errors down by desktop / mobile / tablet, so you can see whether a problem is device-specific. A Users vs Impacted Users chart compares all users against the affected ones per time bucket.
The Pages table
Every page with traffic, with the signals that matter for triage:
| Column | What it shows |
|---|---|
| Pages | The page path — click to open its drill-down |
| Load (RPS) | Load requests per second |
| Load Time | How long the page took overall |
| TTFB | Time to first byte — how long the server took to start answering |
| JS Error % | Share of JavaScript errors (colour-banded bar) |
| API Error % | Share of failed network calls (colour-banded bar) |
| User Impacted | Users who hit an error on this page |
Search pages by name filters the Pages table only — the cards and charts above stay application-wide, and the screen doesn't blank while you type.
With no data in the range, the tab shows "No performance data for this application in the selected time range."
Page drill-down
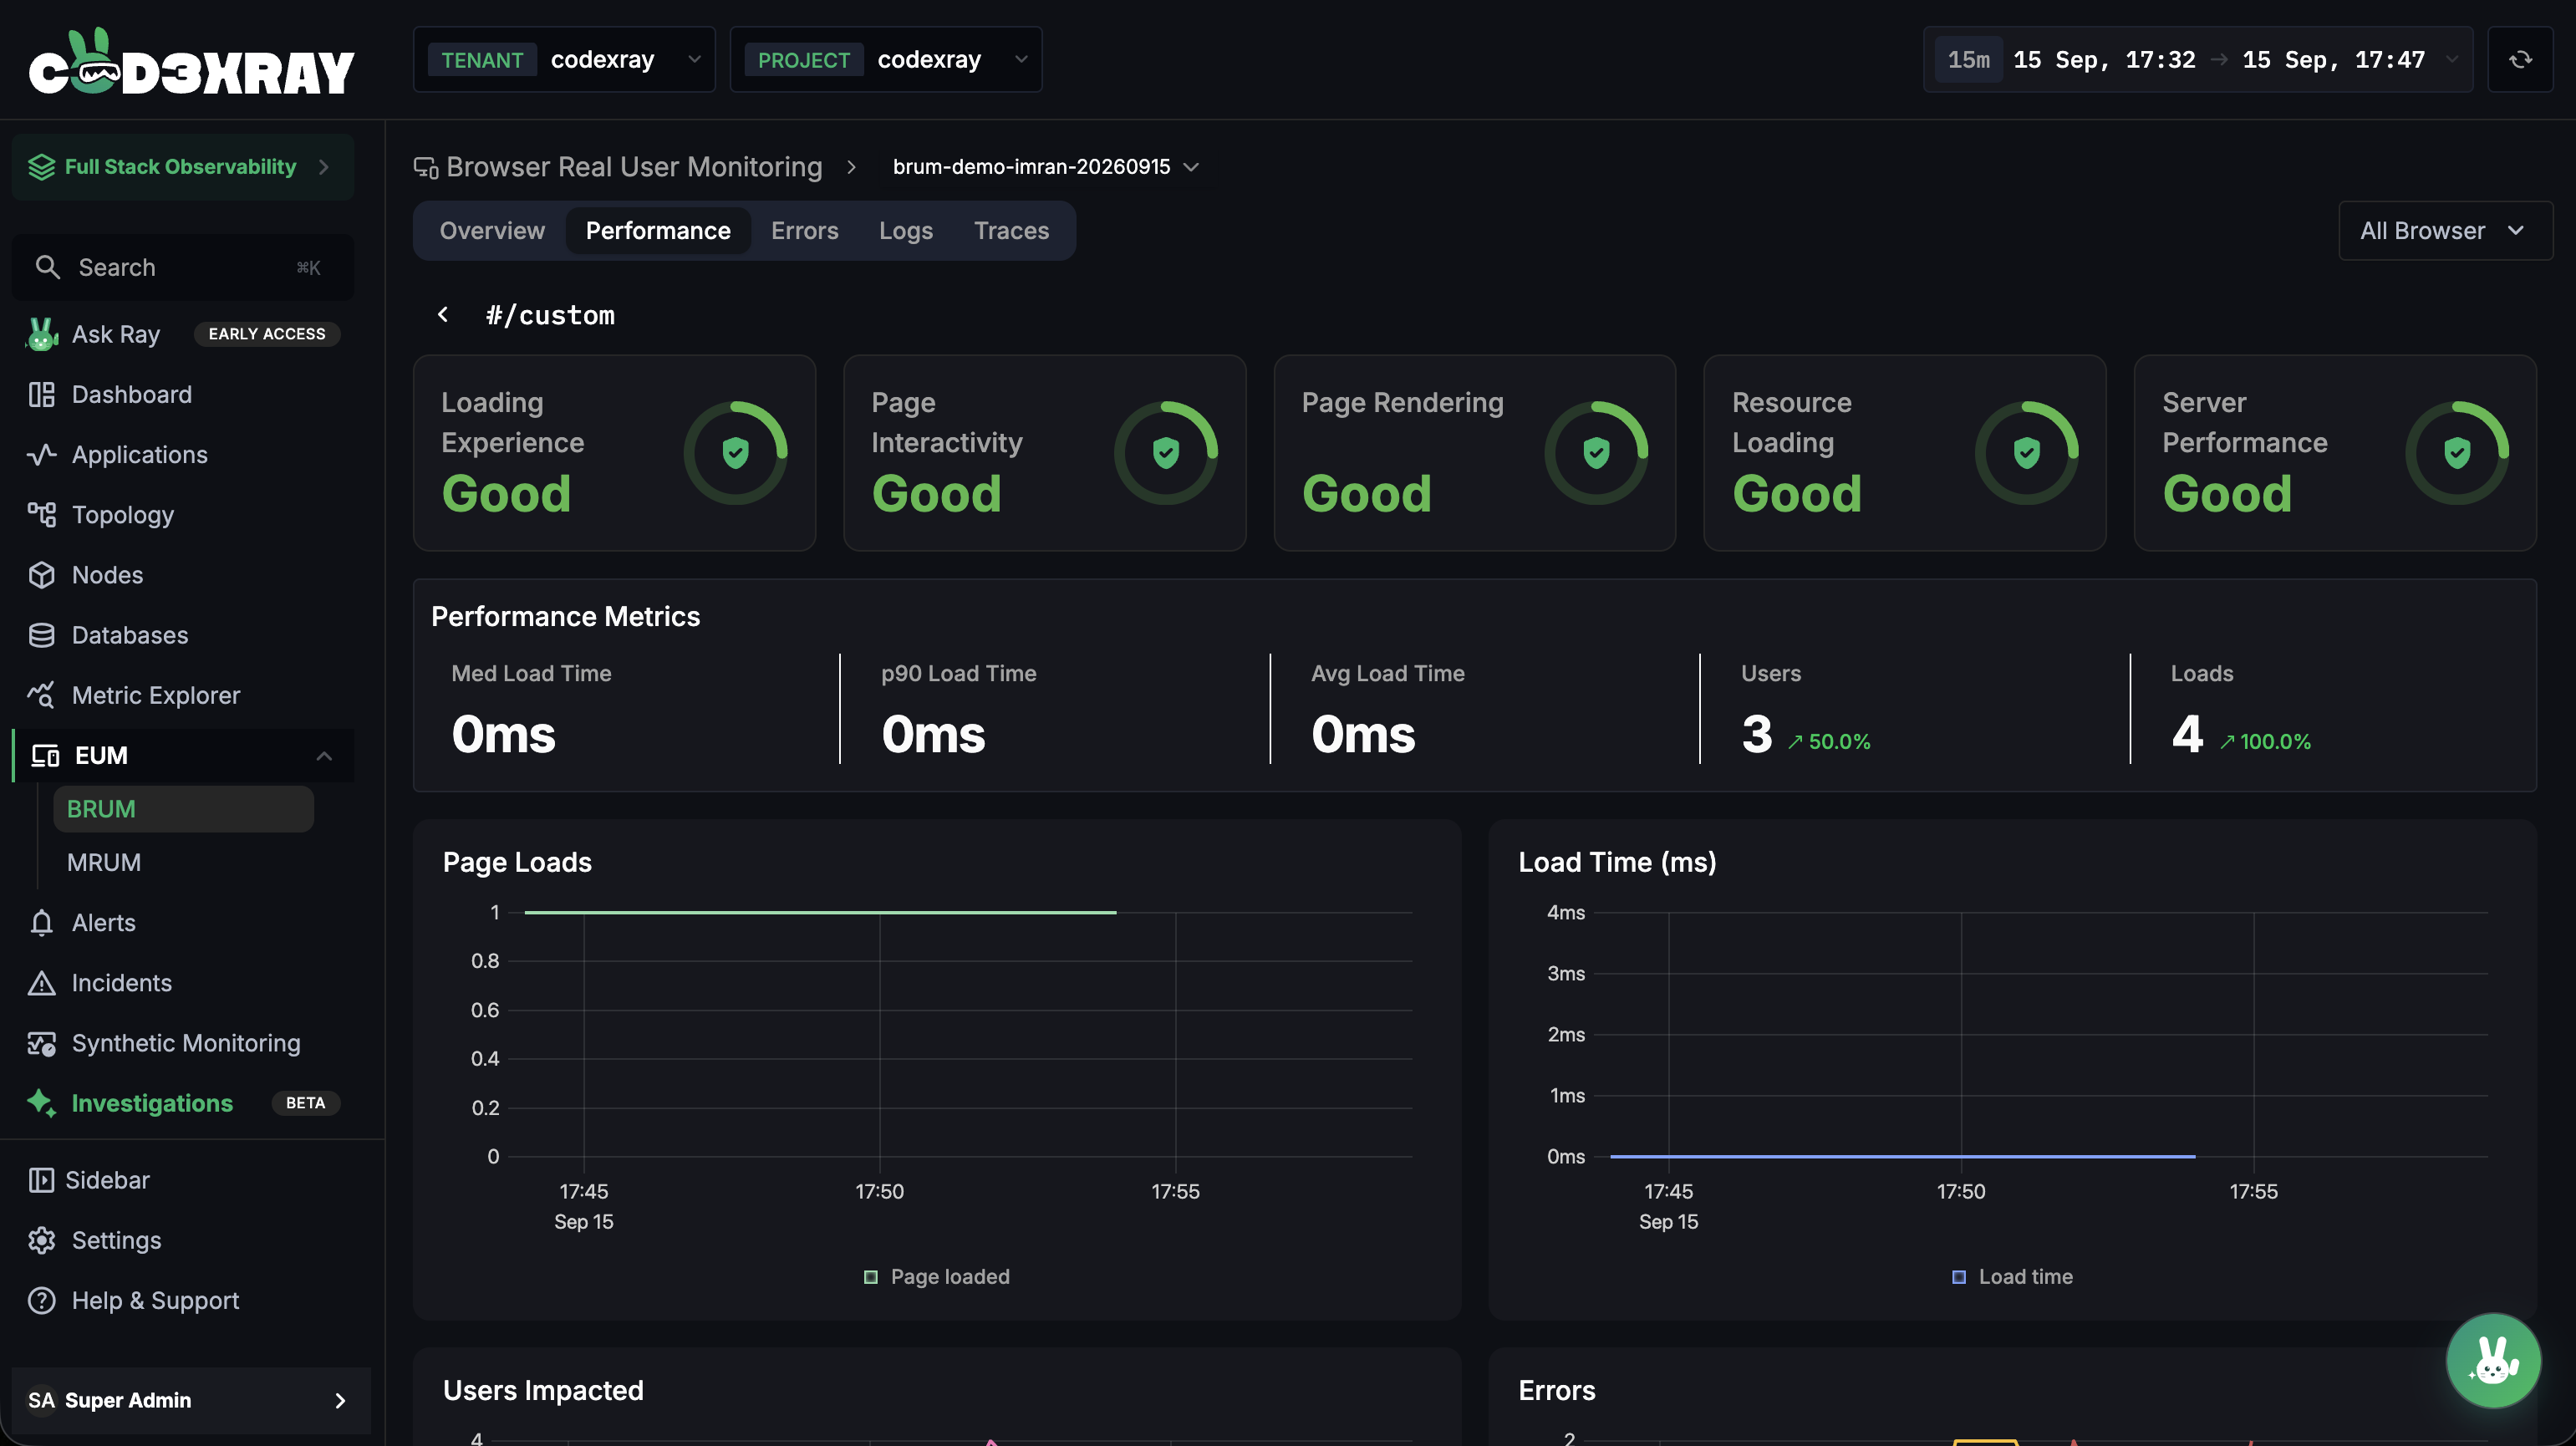
Click a page — from the Pages table here, or from the Page Performance widget on the Overview tab — to open that single page in detail. The back button returns you to wherever you came from.
Quality scores
Five cards rate the page, each Good, Moderate, or Poor:
| Card | What it judges |
|---|---|
| Loading Experience | How the load felt to the user overall |
| Page Interactivity | How quickly the page became usable |
| Page Rendering | How the page painted |
| Resource Loading | How the page's assets loaded |
| Server Performance | How quickly the server responded |
Metrics and charts
A Performance Metrics strip shows Med Load Time, p90 Load Time, Avg Load Time, Users, and Loads (the Users and Loads counts carry a delta arrow). Below it, charts track Page Loads, Load Time (ms), Users Impacted, and Errors, plus a detailed user-centric timing breakdown — all on the same time range as the header.
A page loaded only a handful of times shows zeros or an empty state — never an error.
Next steps
- Errors, Logs & Traces — trace a failing page load back to what the user did
- Applications & Overview — the Applications list and the Overview tab
- BRUM Overview — key terms and how the time range works