Applications & Overview
Open EUM → BRUM in the left navigation. You land on the Applications list — every browser application reporting data — and from there open one application to its Overview tab.
Every BRUM screen is read-only. There's nothing here to create, edit, or delete, so there are no permission-gated buttons — anyone who can see the EUM section can use all of BRUM.
The Applications list
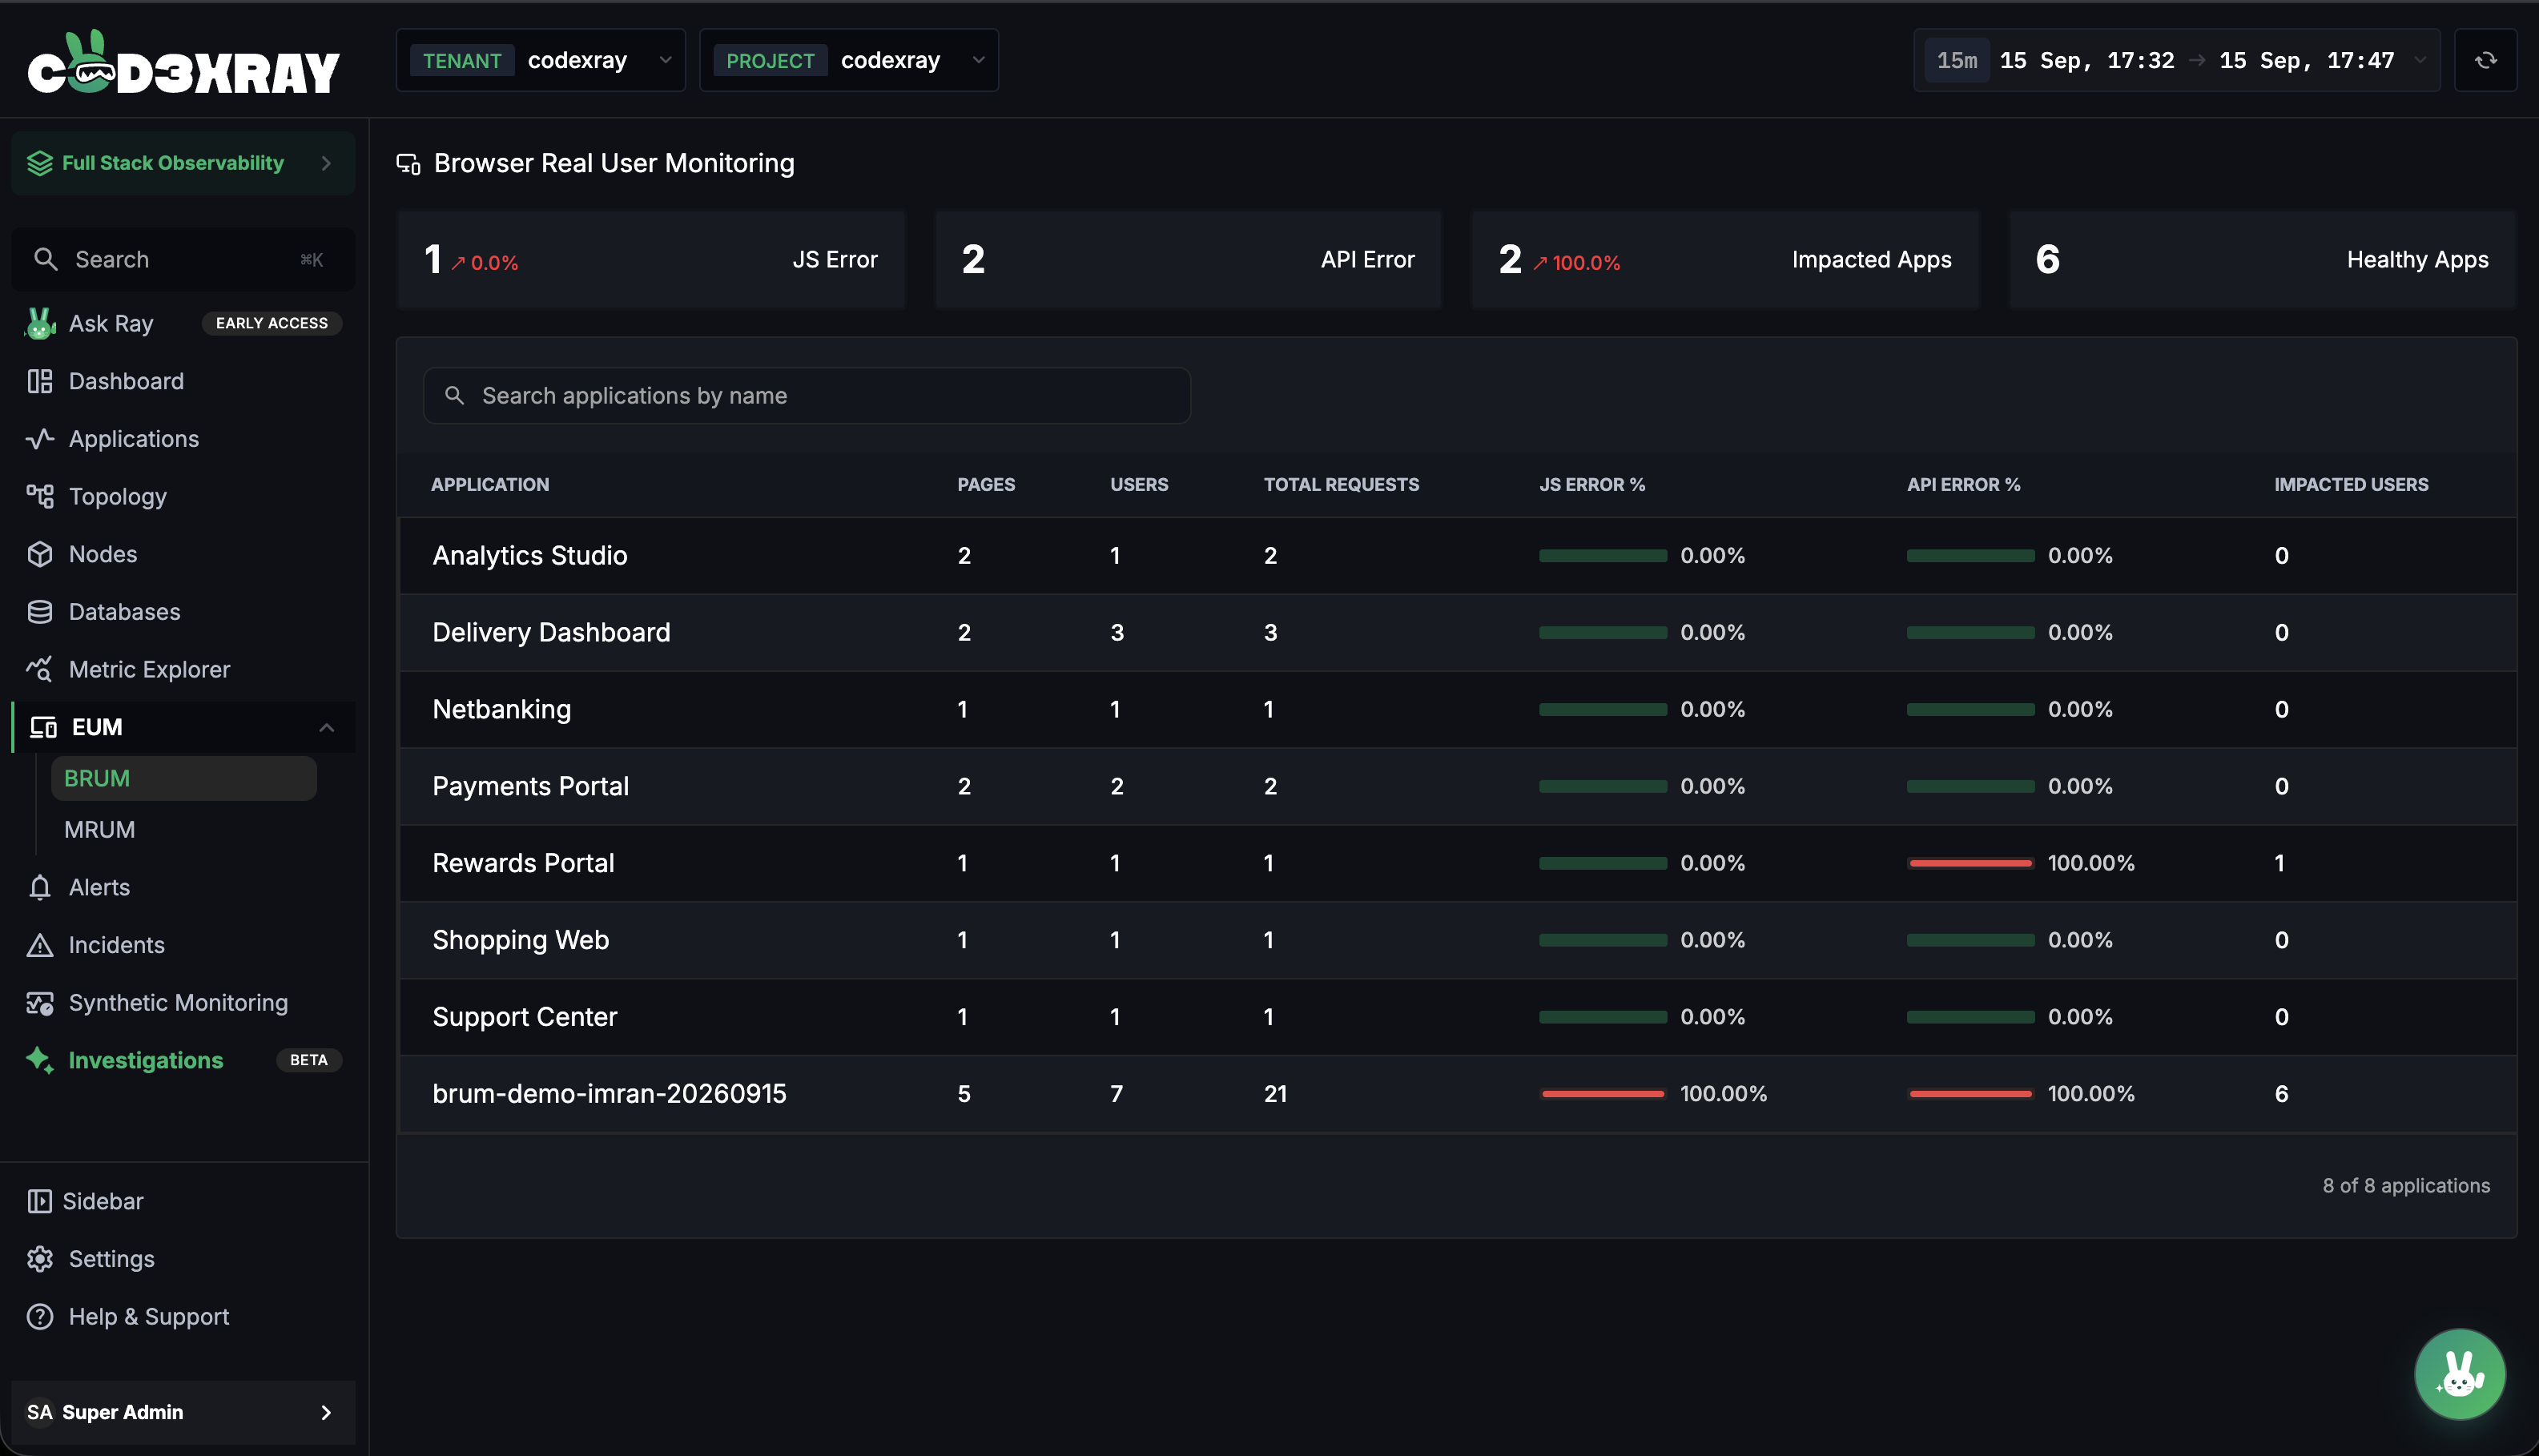
The page is titled Browser Real User Monitoring. It lists every application that reported page loads in the selected time range.
Summary cards
Four cards summarise your fleet of browser apps:
| Card | What it counts |
|---|---|
| JS Error | Applications with JavaScript errors |
| API Error | Applications with failed network calls |
| Impacted Apps | Applications that had at least one error |
| Healthy Apps | Applications with no errors |
Click a card to filter the table to that group; click the active card again to clear. Impacted Apps + Healthy Apps always equals the total number of applications. When there's an earlier window to compare against, a card also shows a delta arrow versus the window before.
The table
| Column | What it shows |
|---|---|
| Application | The app name (from the agent's service setting) — click to open it |
| Pages | How many different pages got traffic |
| Users | Distinct browsers |
| Total Requests | Every page load, refreshes included |
| JS Error % | Share of errors that were JavaScript errors (colour-banded bar) |
| API Error % | Share of errors that were failed network calls (colour-banded bar) |
| Impacted Users | Users who hit at least one error |
Use Search applications by name to filter. If nothing is reporting yet, the page shows: "No browser applications reported in this time range. Install the BRUM agent in your web app to start monitoring."
Opening an application
Click any application to open it. Every application has five tabs — Overview, Performance, Errors, Logs, and Traces — and a breadcrumb application switcher dropdown to jump to another app while keeping the current tab.
The Overview tab
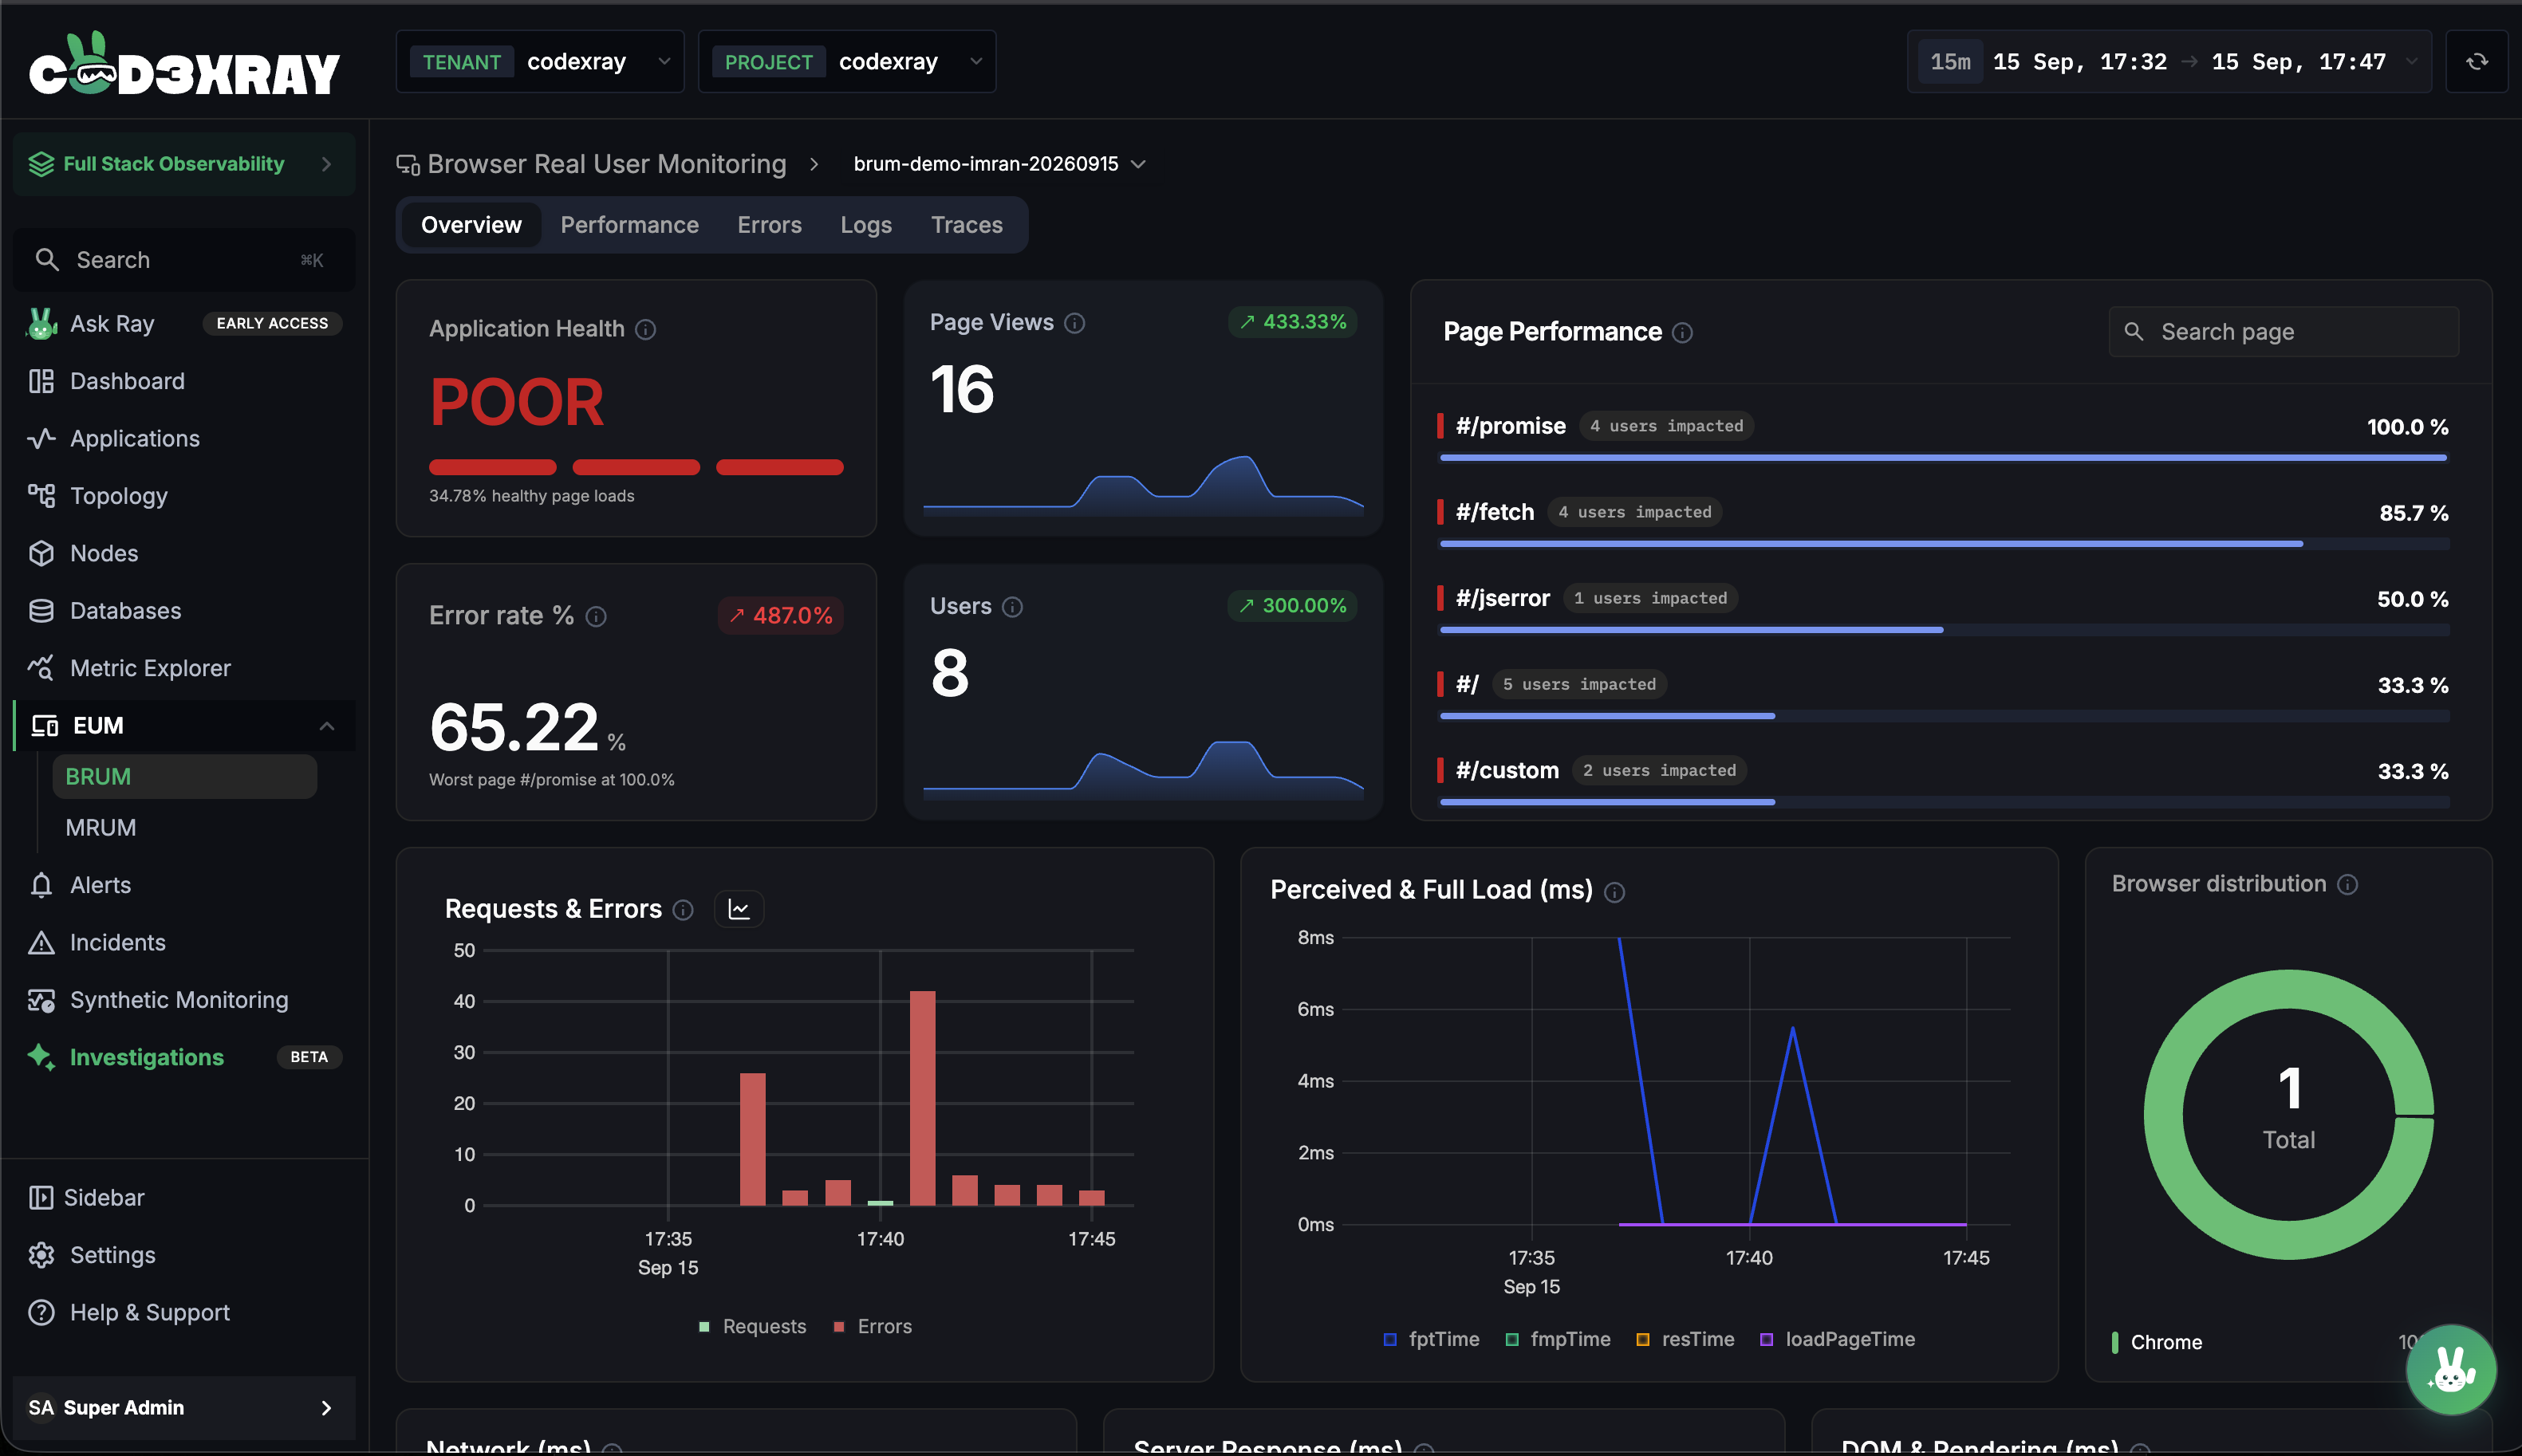
The Overview tab is the application's health at a glance.
Top row — the headline signals
| Widget | What it shows |
|---|---|
| Application Health | GOOD, MODERATE, or POOR, a three-segment bar, and a "…% healthy page loads" line. The word and the percentage always agree. |
| Error rate % | The share of page views with an error. When something is erroring, it names the worst page underneath ("Worst page … at …%"); with nothing erroring, that line is absent. |
| Page Views | Distinct person + page combinations, with a trend sparkline. |
| Users | Distinct browsers, with a trend sparkline. |
| Page Performance | Every page with traffic, worst error-rate first, each with a severity colour bar, a "…users impacted" badge, and its error rate. Page names are clickable — they open the page drill-down. Use Search page to narrow the list. |
Middle row — load speed and browser mix
- Requests & Errors — page loads and errors plotted per time bucket (switchable between bar and line).
- Perceived & Full Load (ms) — how quickly the page felt loaded, over time.
- Browser distribution — a donut of the top browsers (at most four slices: top three plus "Other"); the number in the centre is how many different browsers were seen.
Bottom row — the timing breakdown
Three more time-series charts break the load down by phase, each titled in milliseconds: Network (ms), Server Response (ms), and DOM & Rendering (ms). Together with Perceived & Full Load, these are the four timing charts — each has its own scale, so a slow phase stands out.
Before an application has any data in the selected range, the Overview shows "No browser data for this application in the selected time range." — not a blank screen or an error.
Next steps
- Performance & Page Details — page speed by browser and device, and the per-page drill-down
- Errors, Logs & Traces — from an error to a single occurrence and its trace
- BRUM Overview — key terms and how the time range works