Errors, Logs & Traces
The last three tabs are for investigation: Errors groups what's breaking, Logs shows console output over time, and Traces reconstructs what a single visitor's browser actually did.
Errors tab
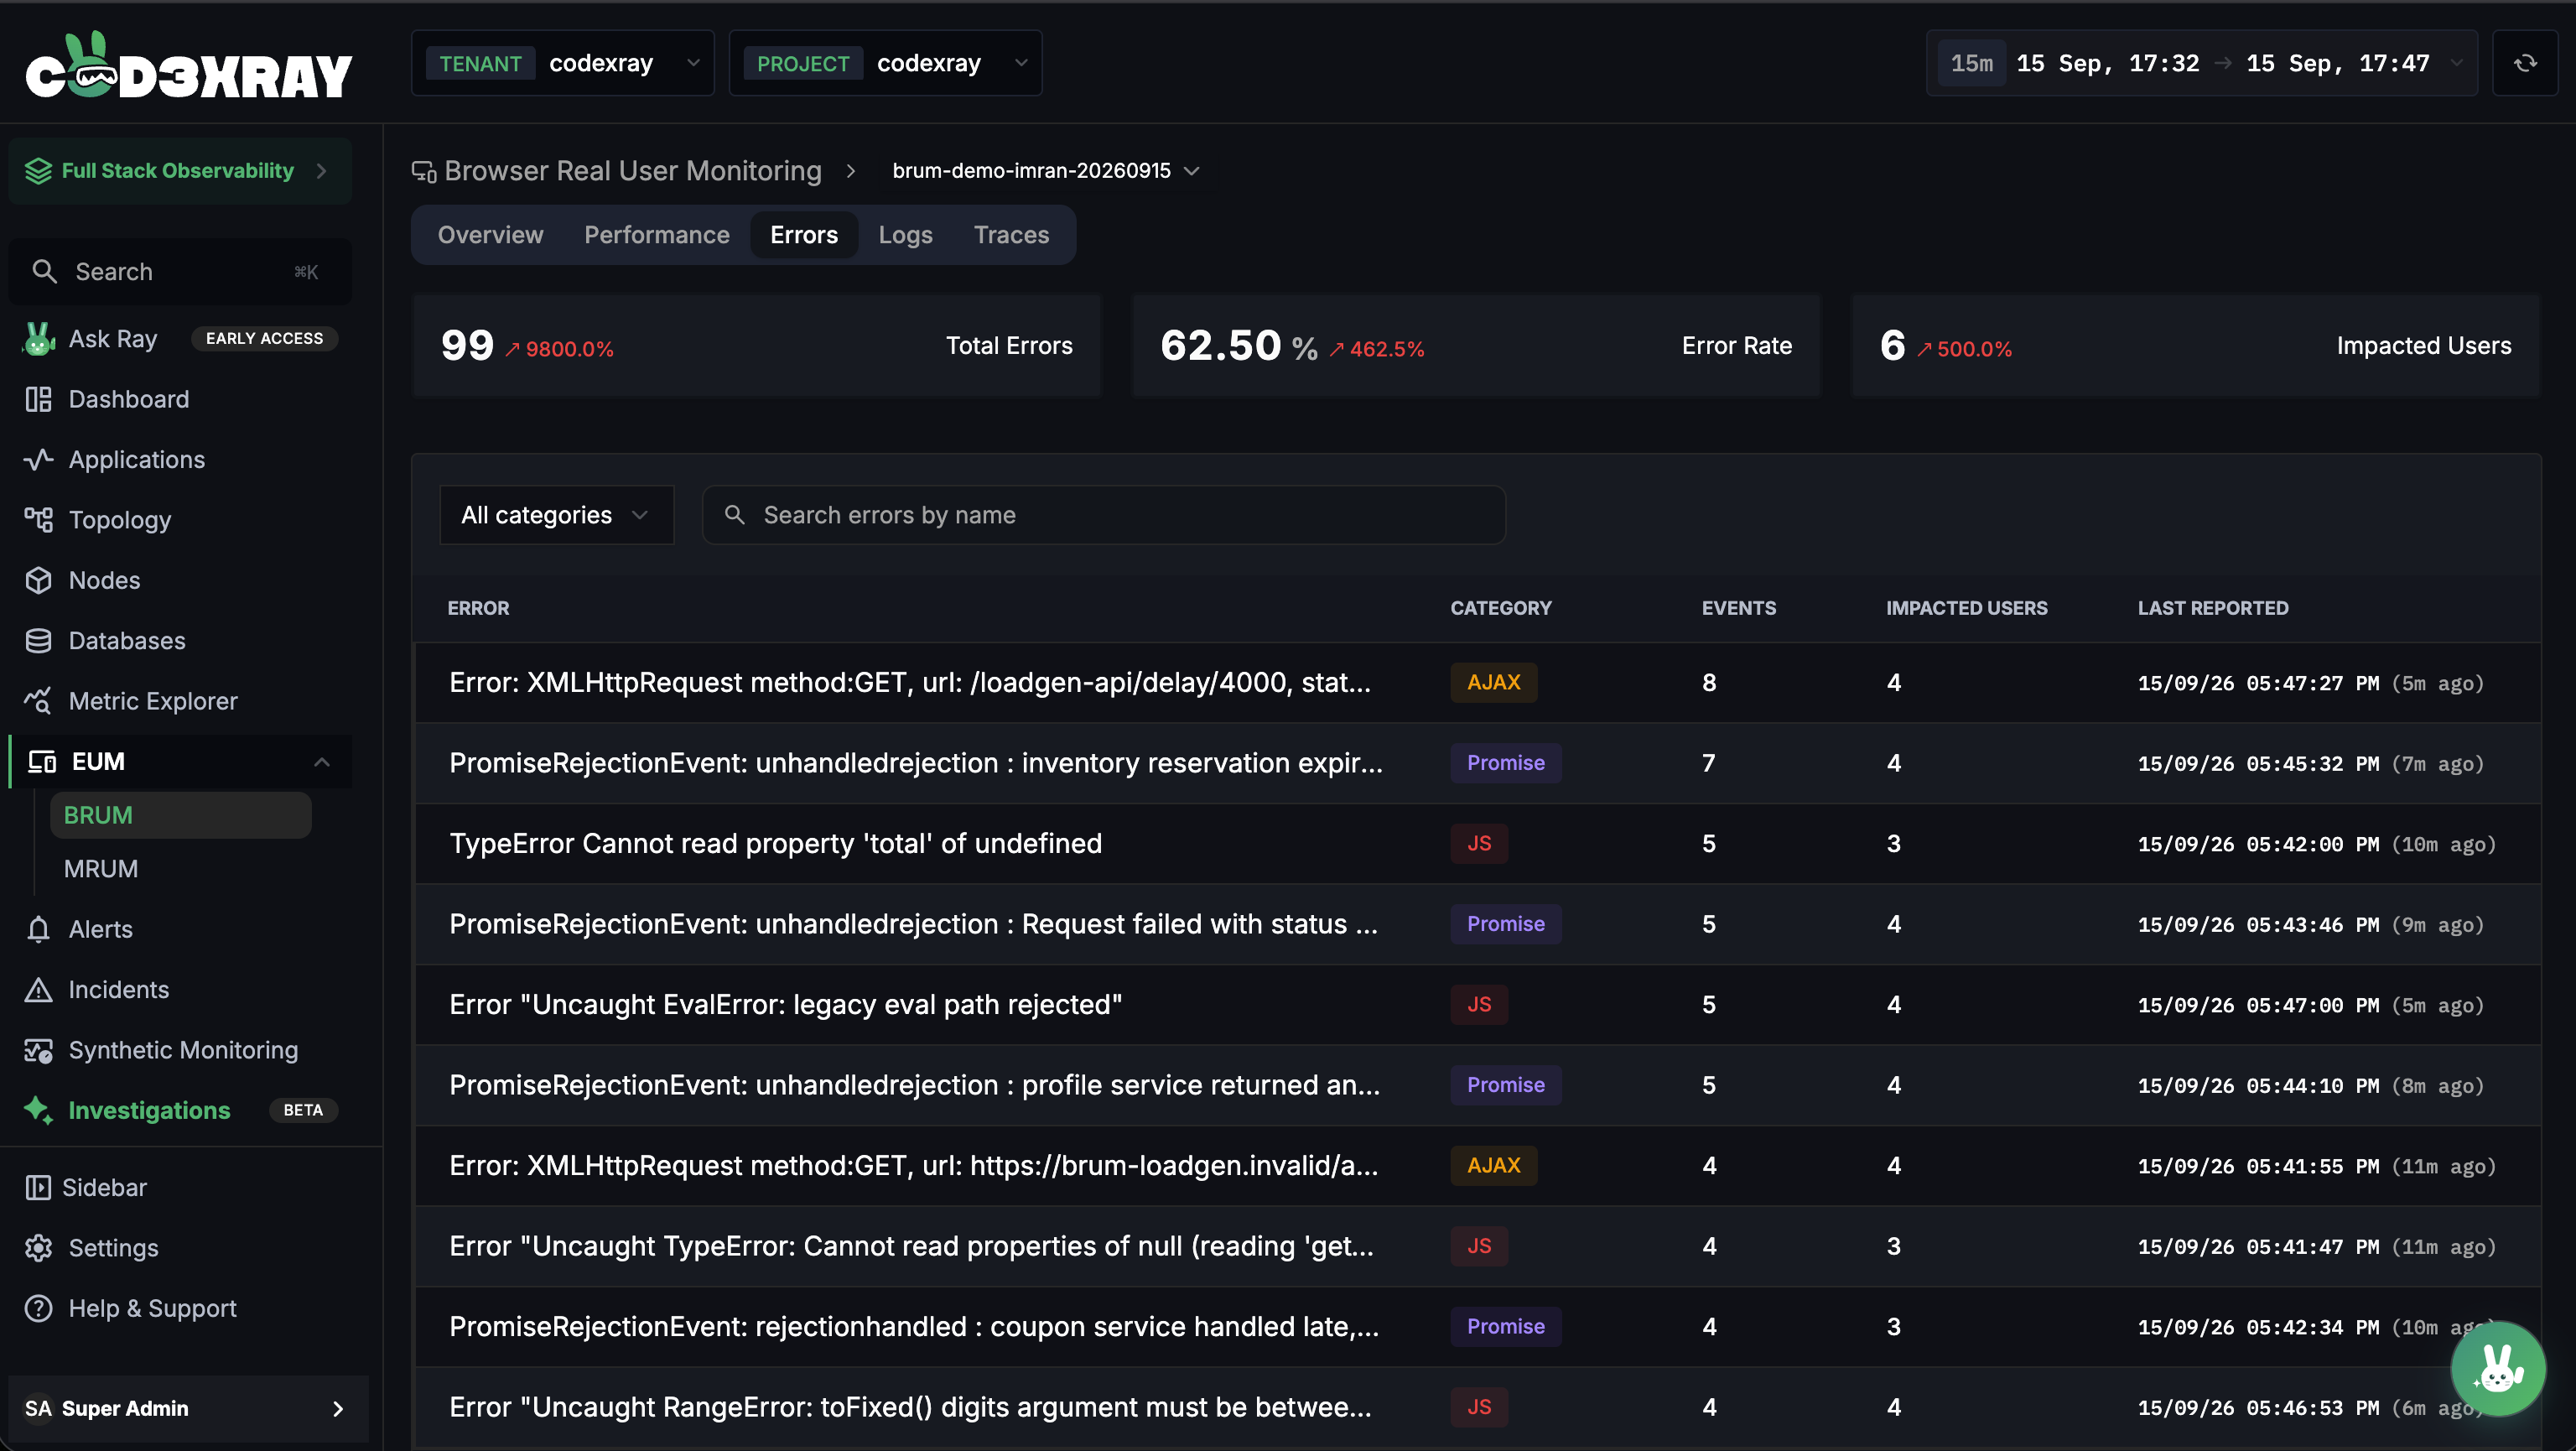
Three cards head the tab — Total Errors, Error Rate, and Impacted Users (each counts a person once, however many different errors they hit).
Below, errors are grouped by name so the same error appearing many times is one row:
| Column | What it shows |
|---|---|
| Error | The error name |
| Category | A colour chip — JS, AJAX, API, Promise, Vue, or Resource |
| Events | How many times it happened |
| Impacted Users | How many people hit it |
| Last Reported | When it was last seen (with a relative time) |
Filter with the All categories dropdown, Search errors by name, sort, and page — all at once, without losing each other.
From a group to a single occurrence
Click an error group to open its occurrences — one row per time it happened, with Event ID, Time, User, Page, Device, OS, and Browser. Search them by user or page.
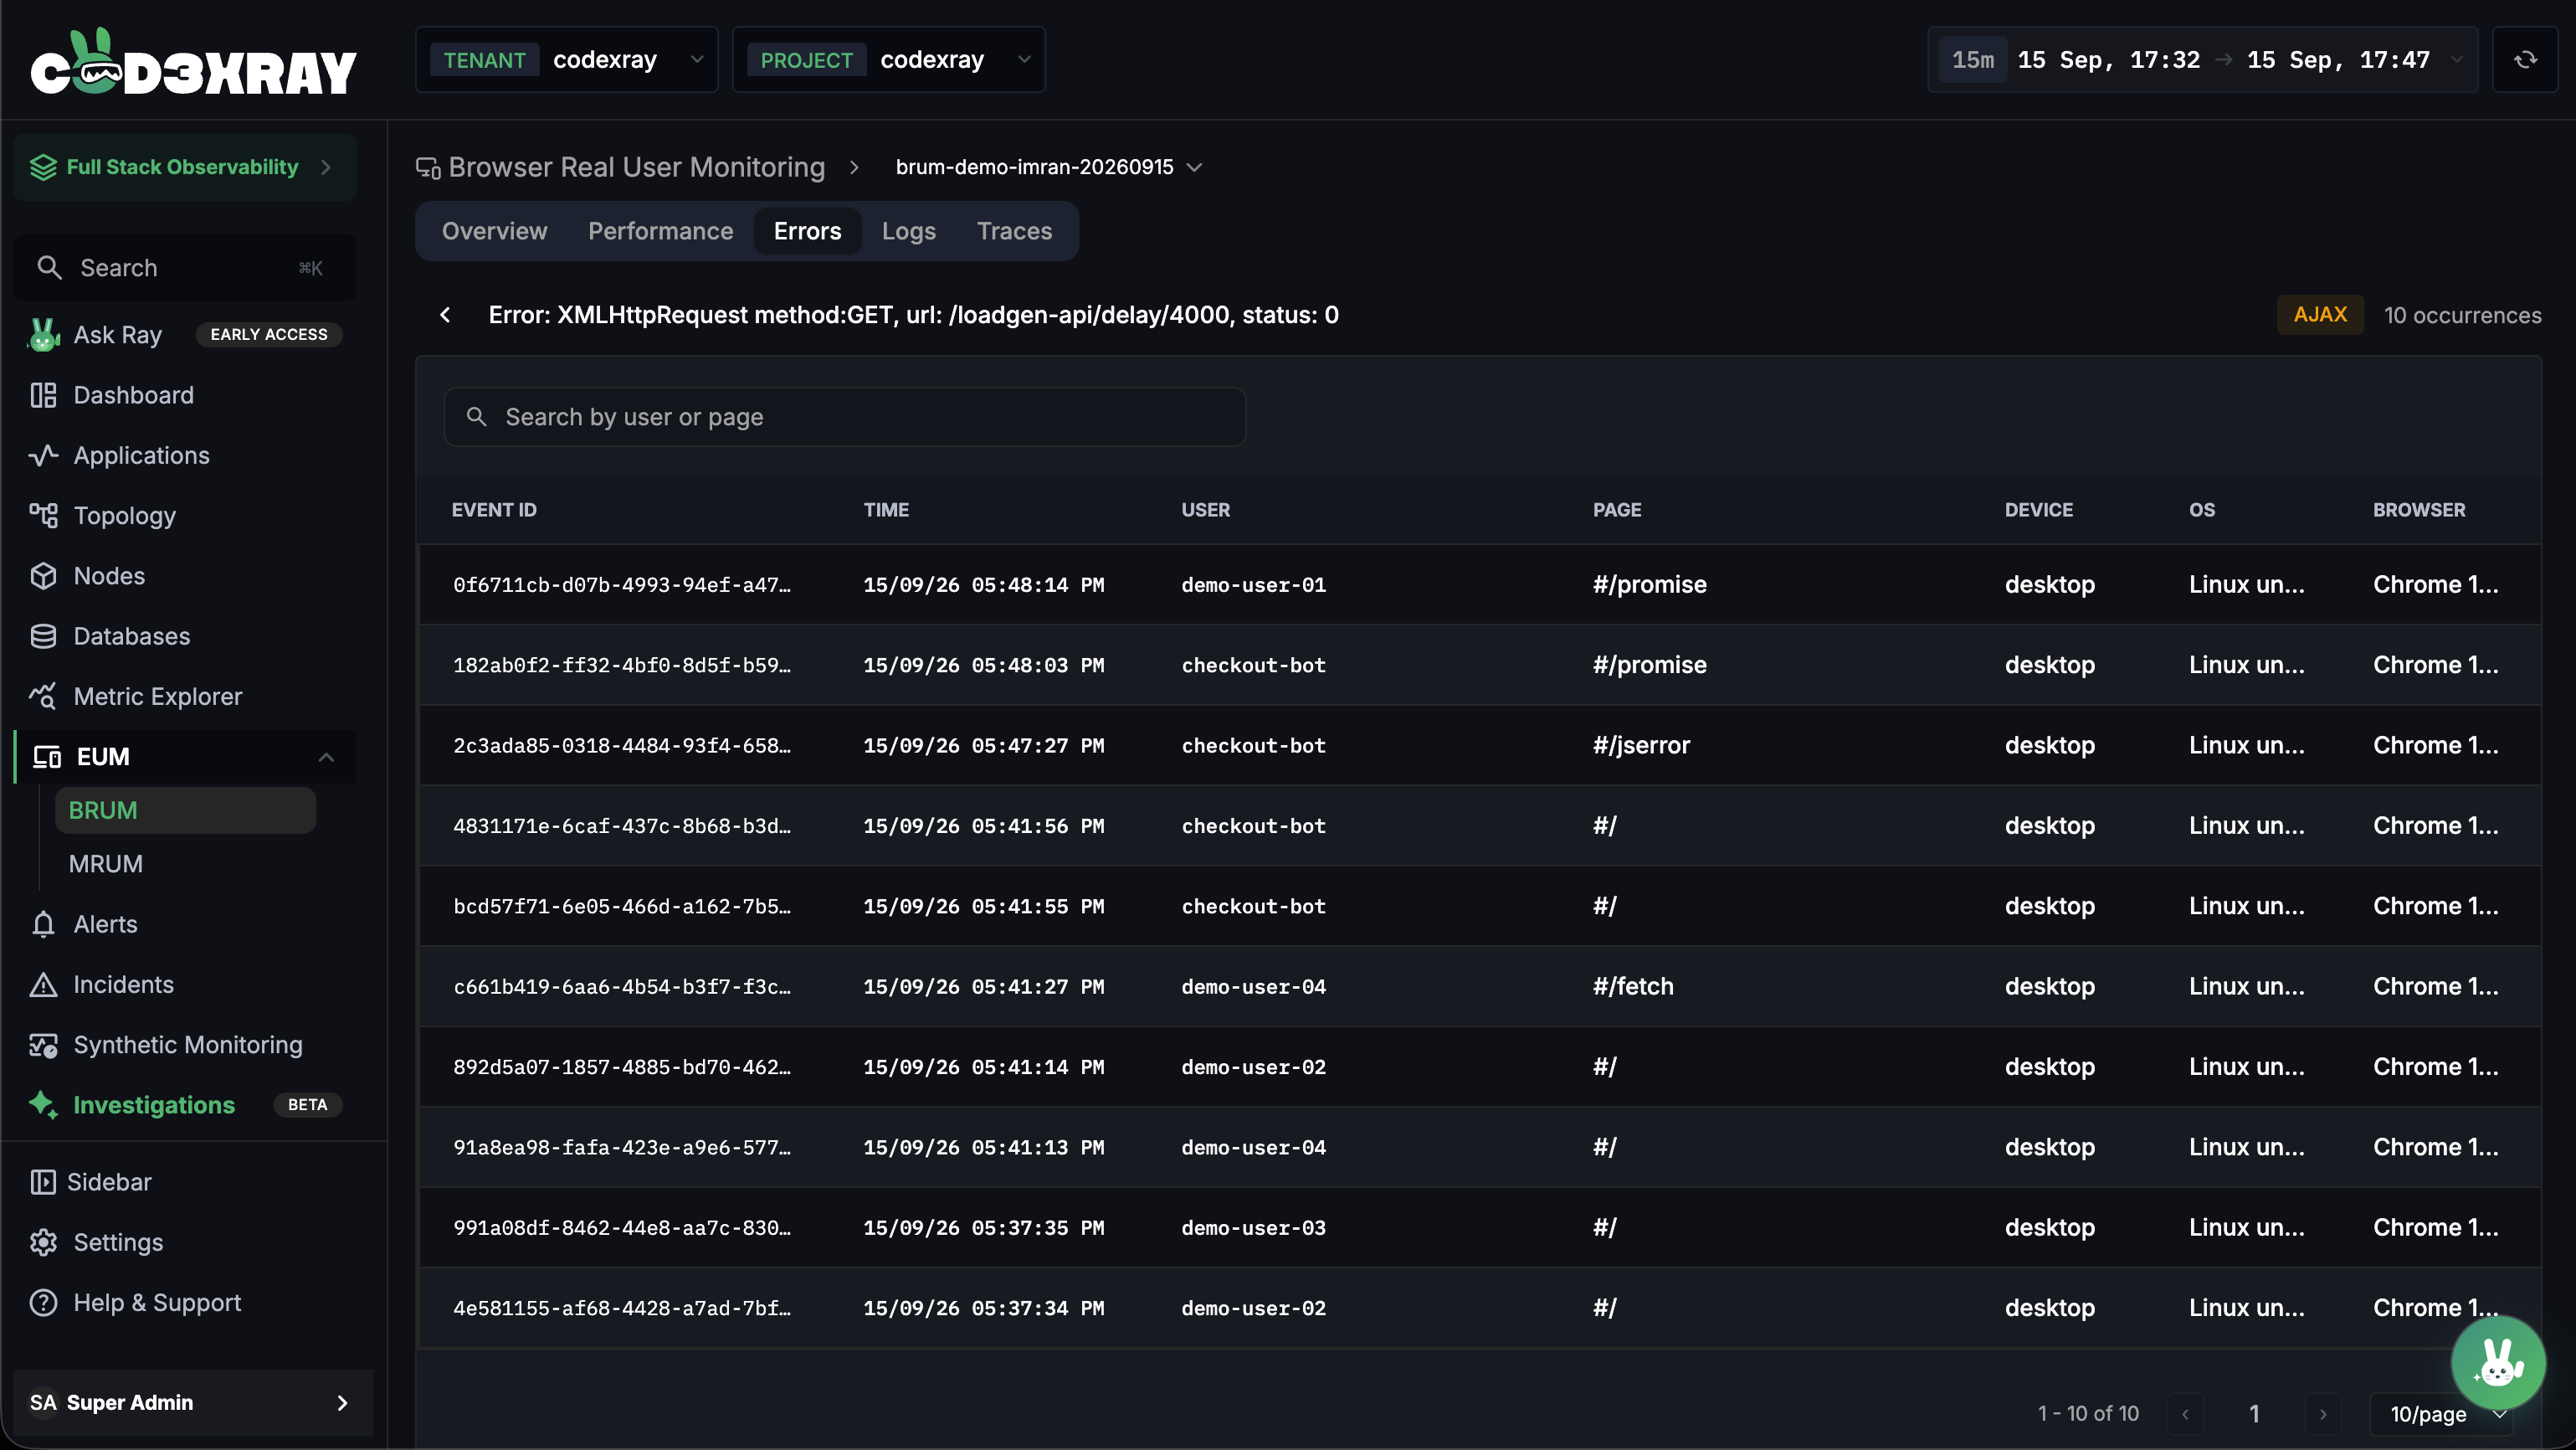
Click an occurrence to open its detail, which is where a browser error becomes reproducible:
- Error Message — the exact message.
- Error URL — the page it happened on, with a Copy URL button.
- Incident Metadata — Category, App, Version, Timestamp, Occurrences, and Grade.
- Stack Trace — with a Copy stack trace button. When source maps are available it shows an Original source badge; otherwise it notes the trace is minified for that version. Frames from dependencies can be collapsed.
- Breadcrumbs — a table of what the user did before the error (Type, Category, Description, Level, Time), so you can see the steps that led to it.
There's a way back at every level — occurrence → occurrences → group list → application — keeping your filters as you go.
Start on the Errors tab, sort by Impacted Users to find what's hurting the most people, open the group, pick one occurrence, and read its stack trace and breadcrumbs. That's the shortest path from a number to a reproducible bug.
With nothing erroring, the tab shows "No errors reported in this time range."
Logs tab
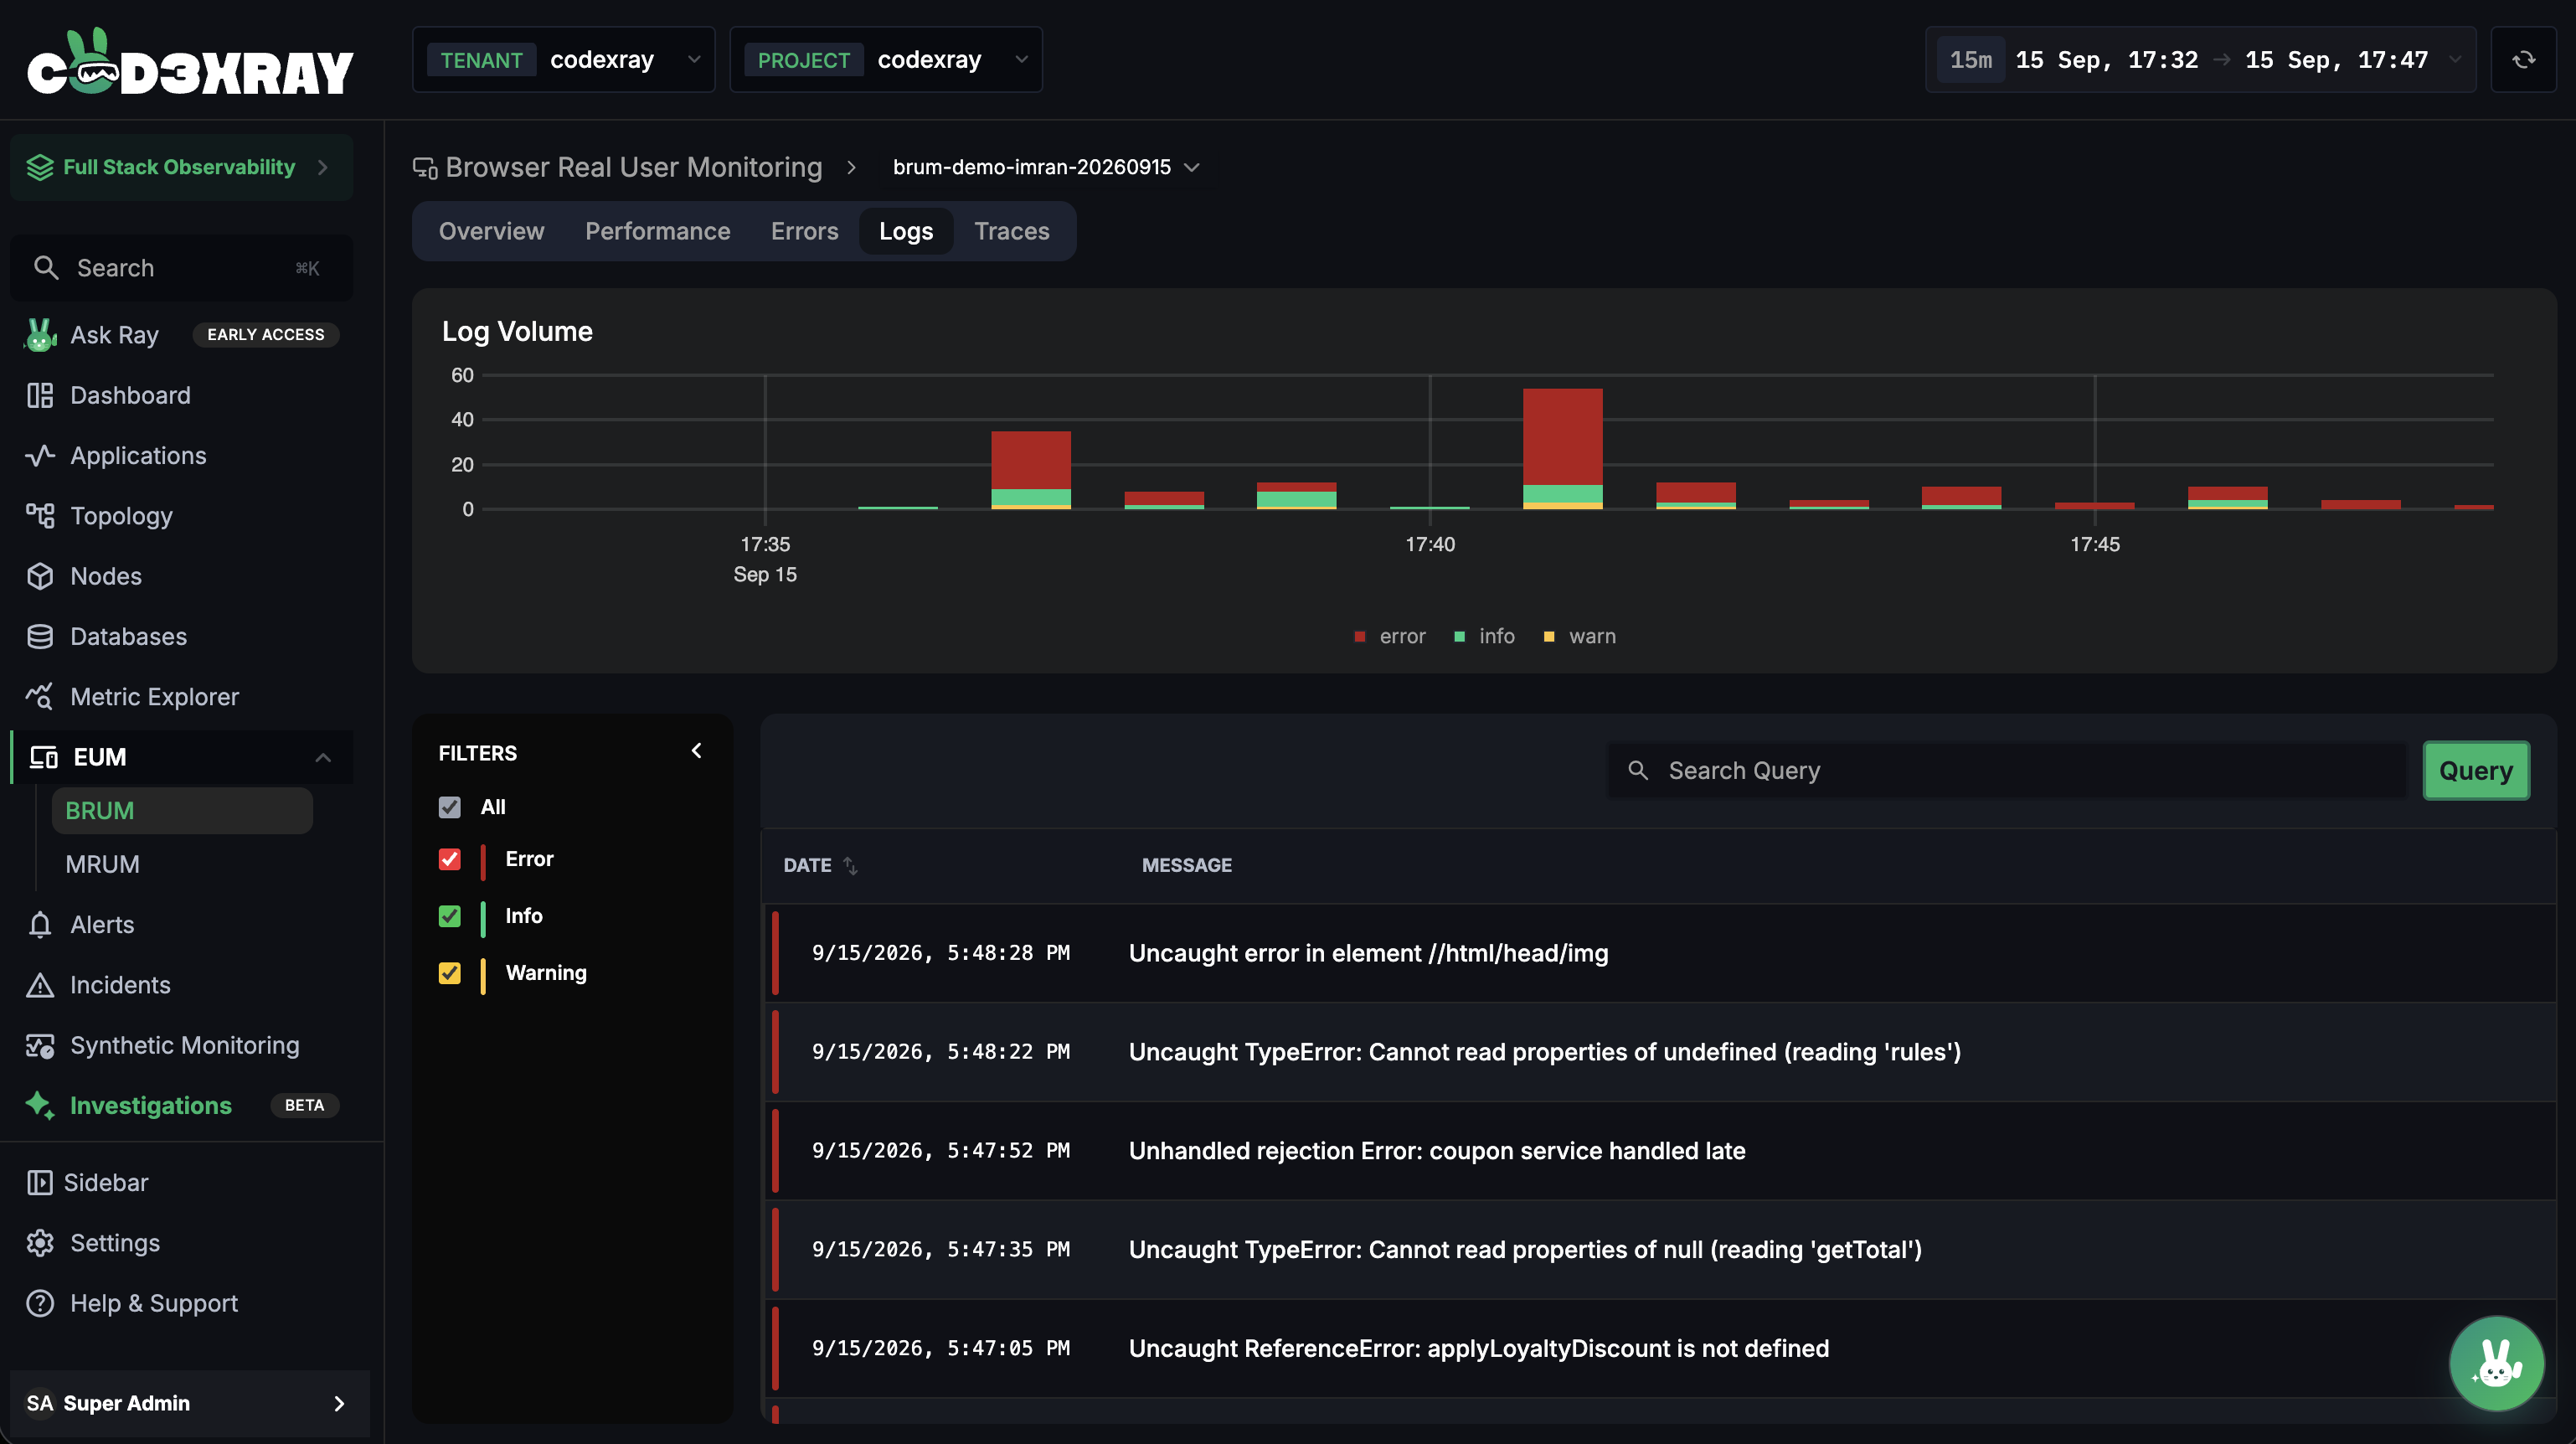
The Logs tab shows browser console output over time.
- A stacked bar chart plots log volume per time bucket, coloured by severity (Error, Warning, Info, and more).
- A FILTERS sidebar lets you tick the severities you care about, and a query field filters the table — both filter the table only; the chart always shows the whole window.
- The table has two columns — DATE (with a severity colour bar) and MESSAGE. Click a line to open its full detail.
With nothing to show, the tab reads "No logs reported in this time range."
Traces tab
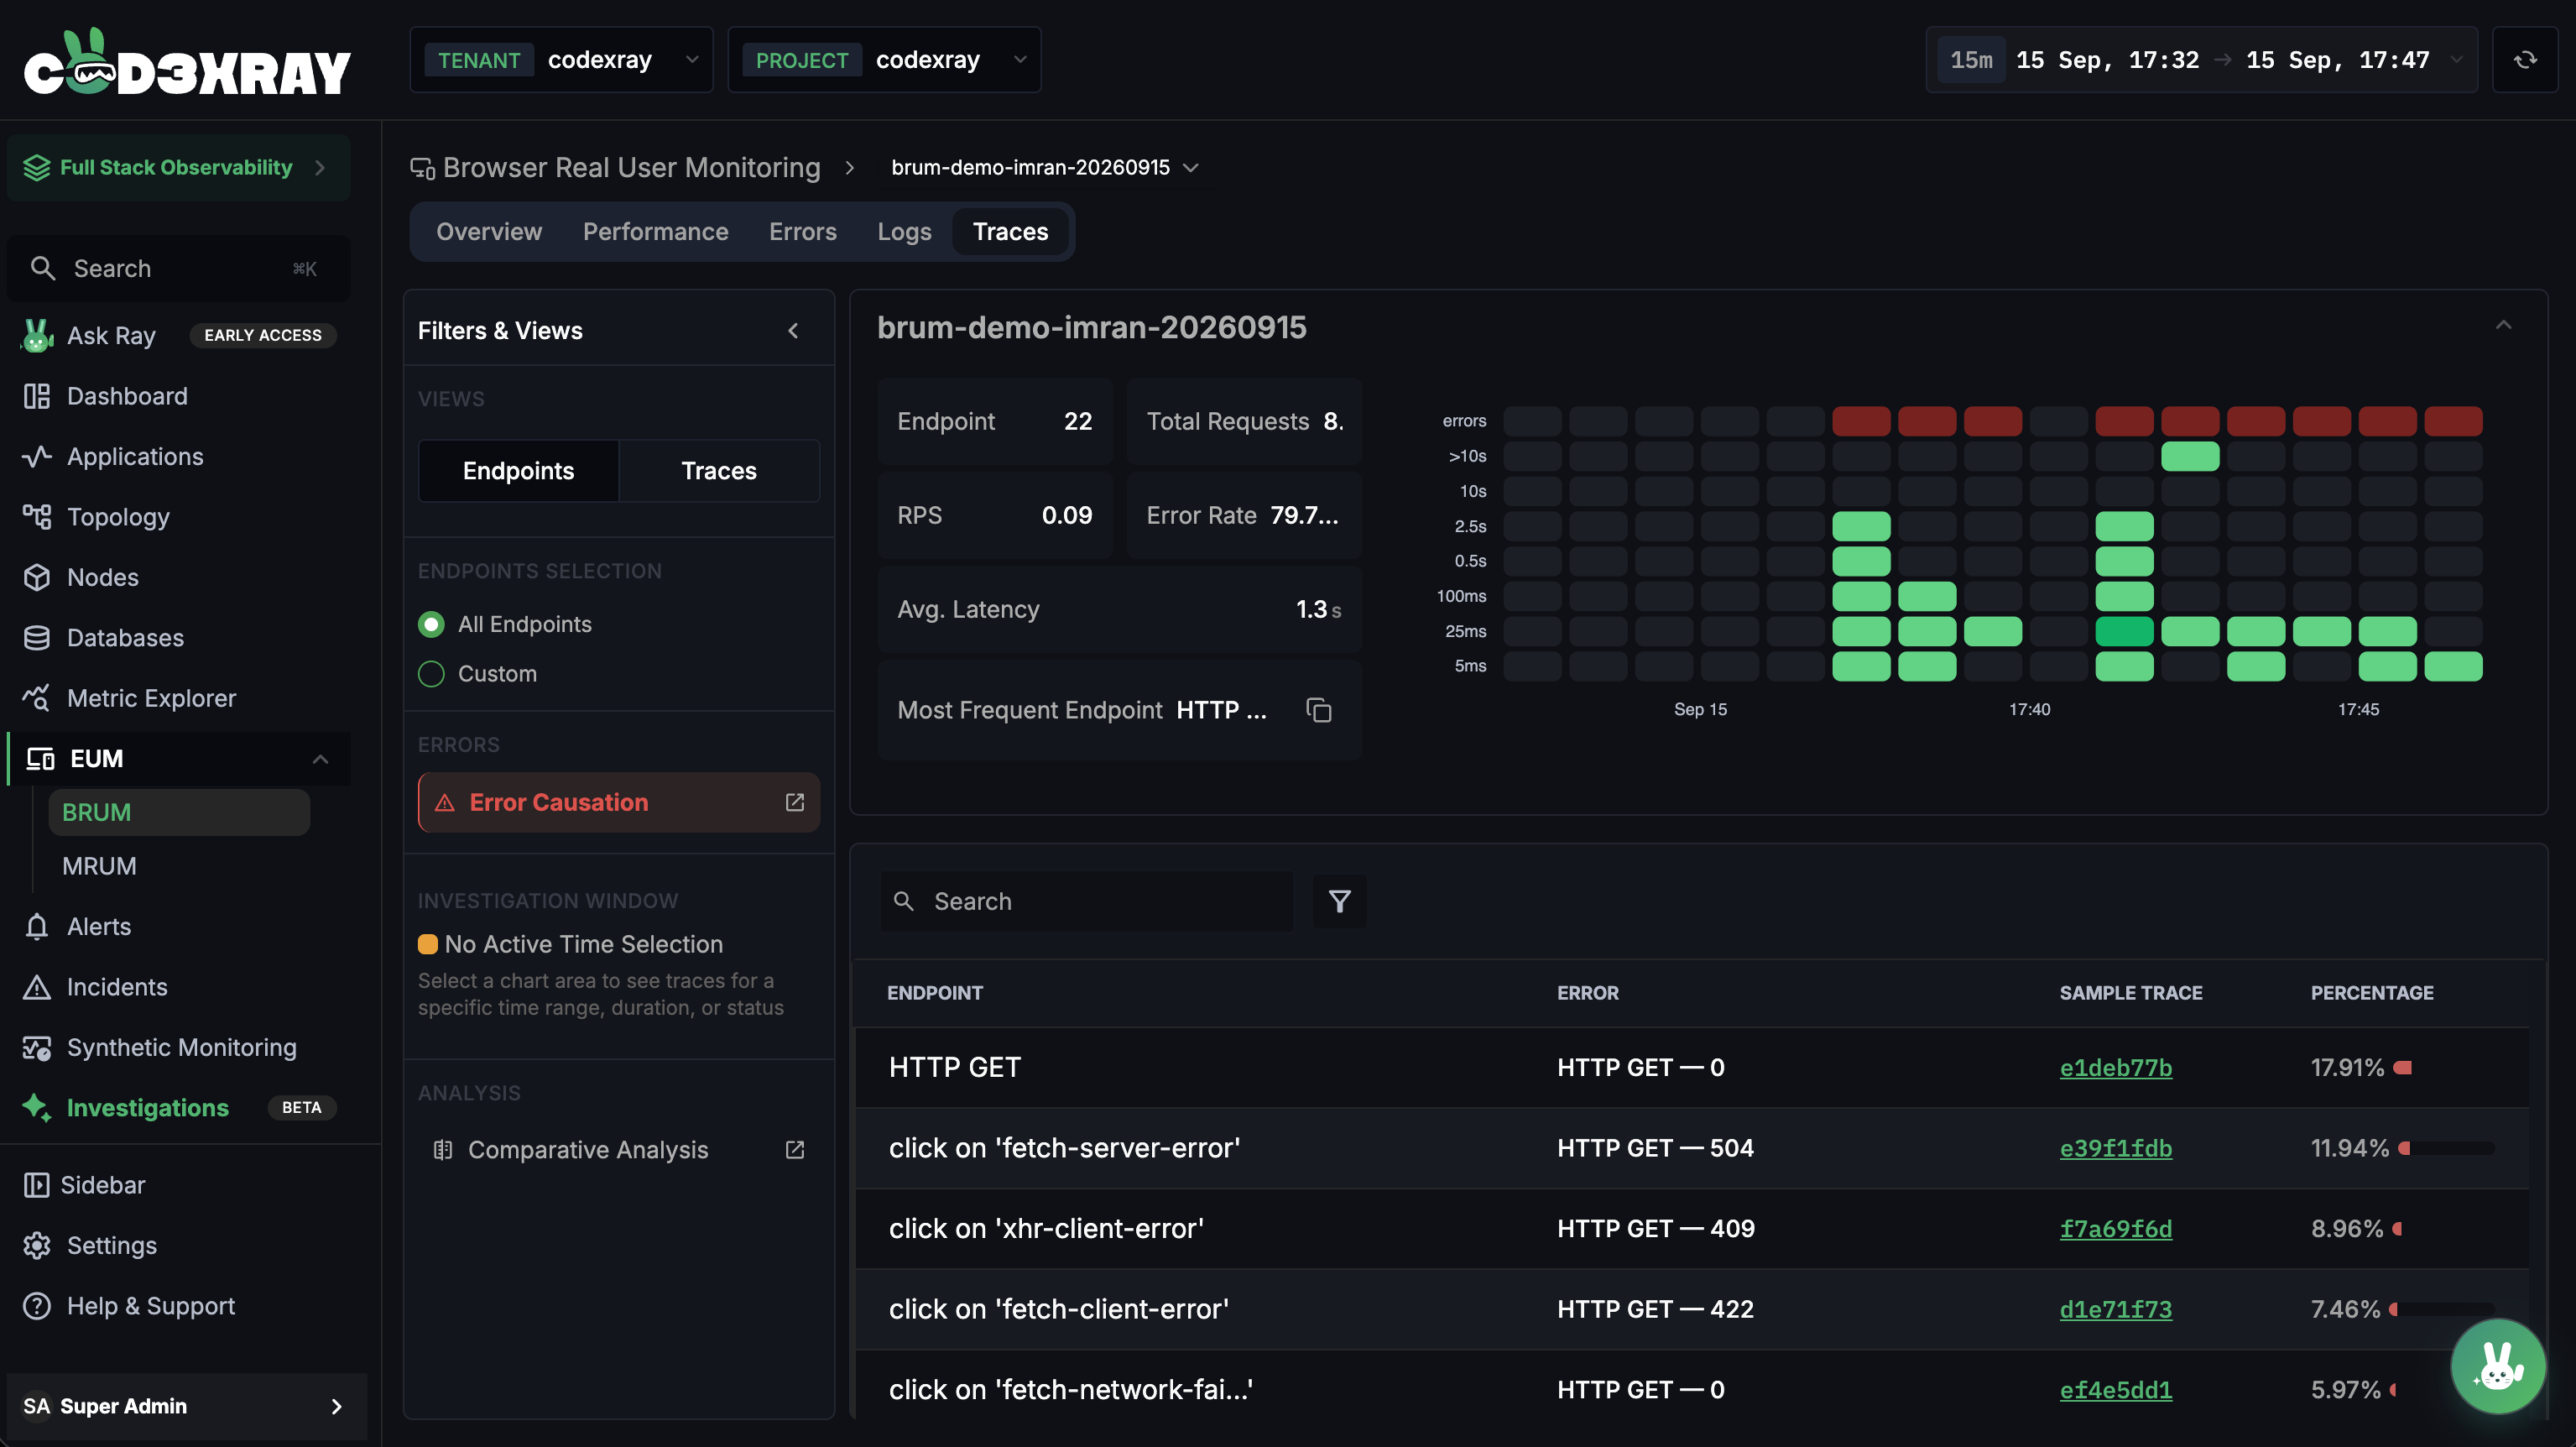
The Traces tab is the same trace explorer as APM, scoped to the browser — Endpoints and Traces sub-tabs, a heatmap, cards, charts, and tables. Traces count what the visitor did, not spans: one page load with ten steps counts once.
Endpoint names read like real actions — "Navigation: /checkout", "click on 'Pay'", "HTTP GET".
The trace waterfall
Click any trace to open its waterfall:
- A Trace ID pill with a Copy trace ID button, and a status pill reading OK or Error.
- A Waterfall / Tree toggle to switch the layout.
- Search spans or attributes to find a step inside the trace.
- A per-span detail panel.
- A very large trace shows a banner — "This trace is very large; near-identical spans are grouped."
Changing the time range while a waterfall is open doesn't blank it, and the back button returns you to the trace list with the Traces tab still selected.
A page-load trace contains the nested steps of the load — the document, its resources, and any network calls — but doesn't yet follow onward into backend services. BRUM traces are browser-side.
Next steps
- Applications & Overview — the Applications list and the Overview tab
- Performance & Page Details — page speed by browser, device, and page
- BRUM Overview — key terms and how the time range works