Reading Job Results
Click any job in the jobs list to open its results page — everything that job has recorded, in one place. A breadcrumb takes you back to the list, and a dropdown next to the job name switches to another job without leaving the page.
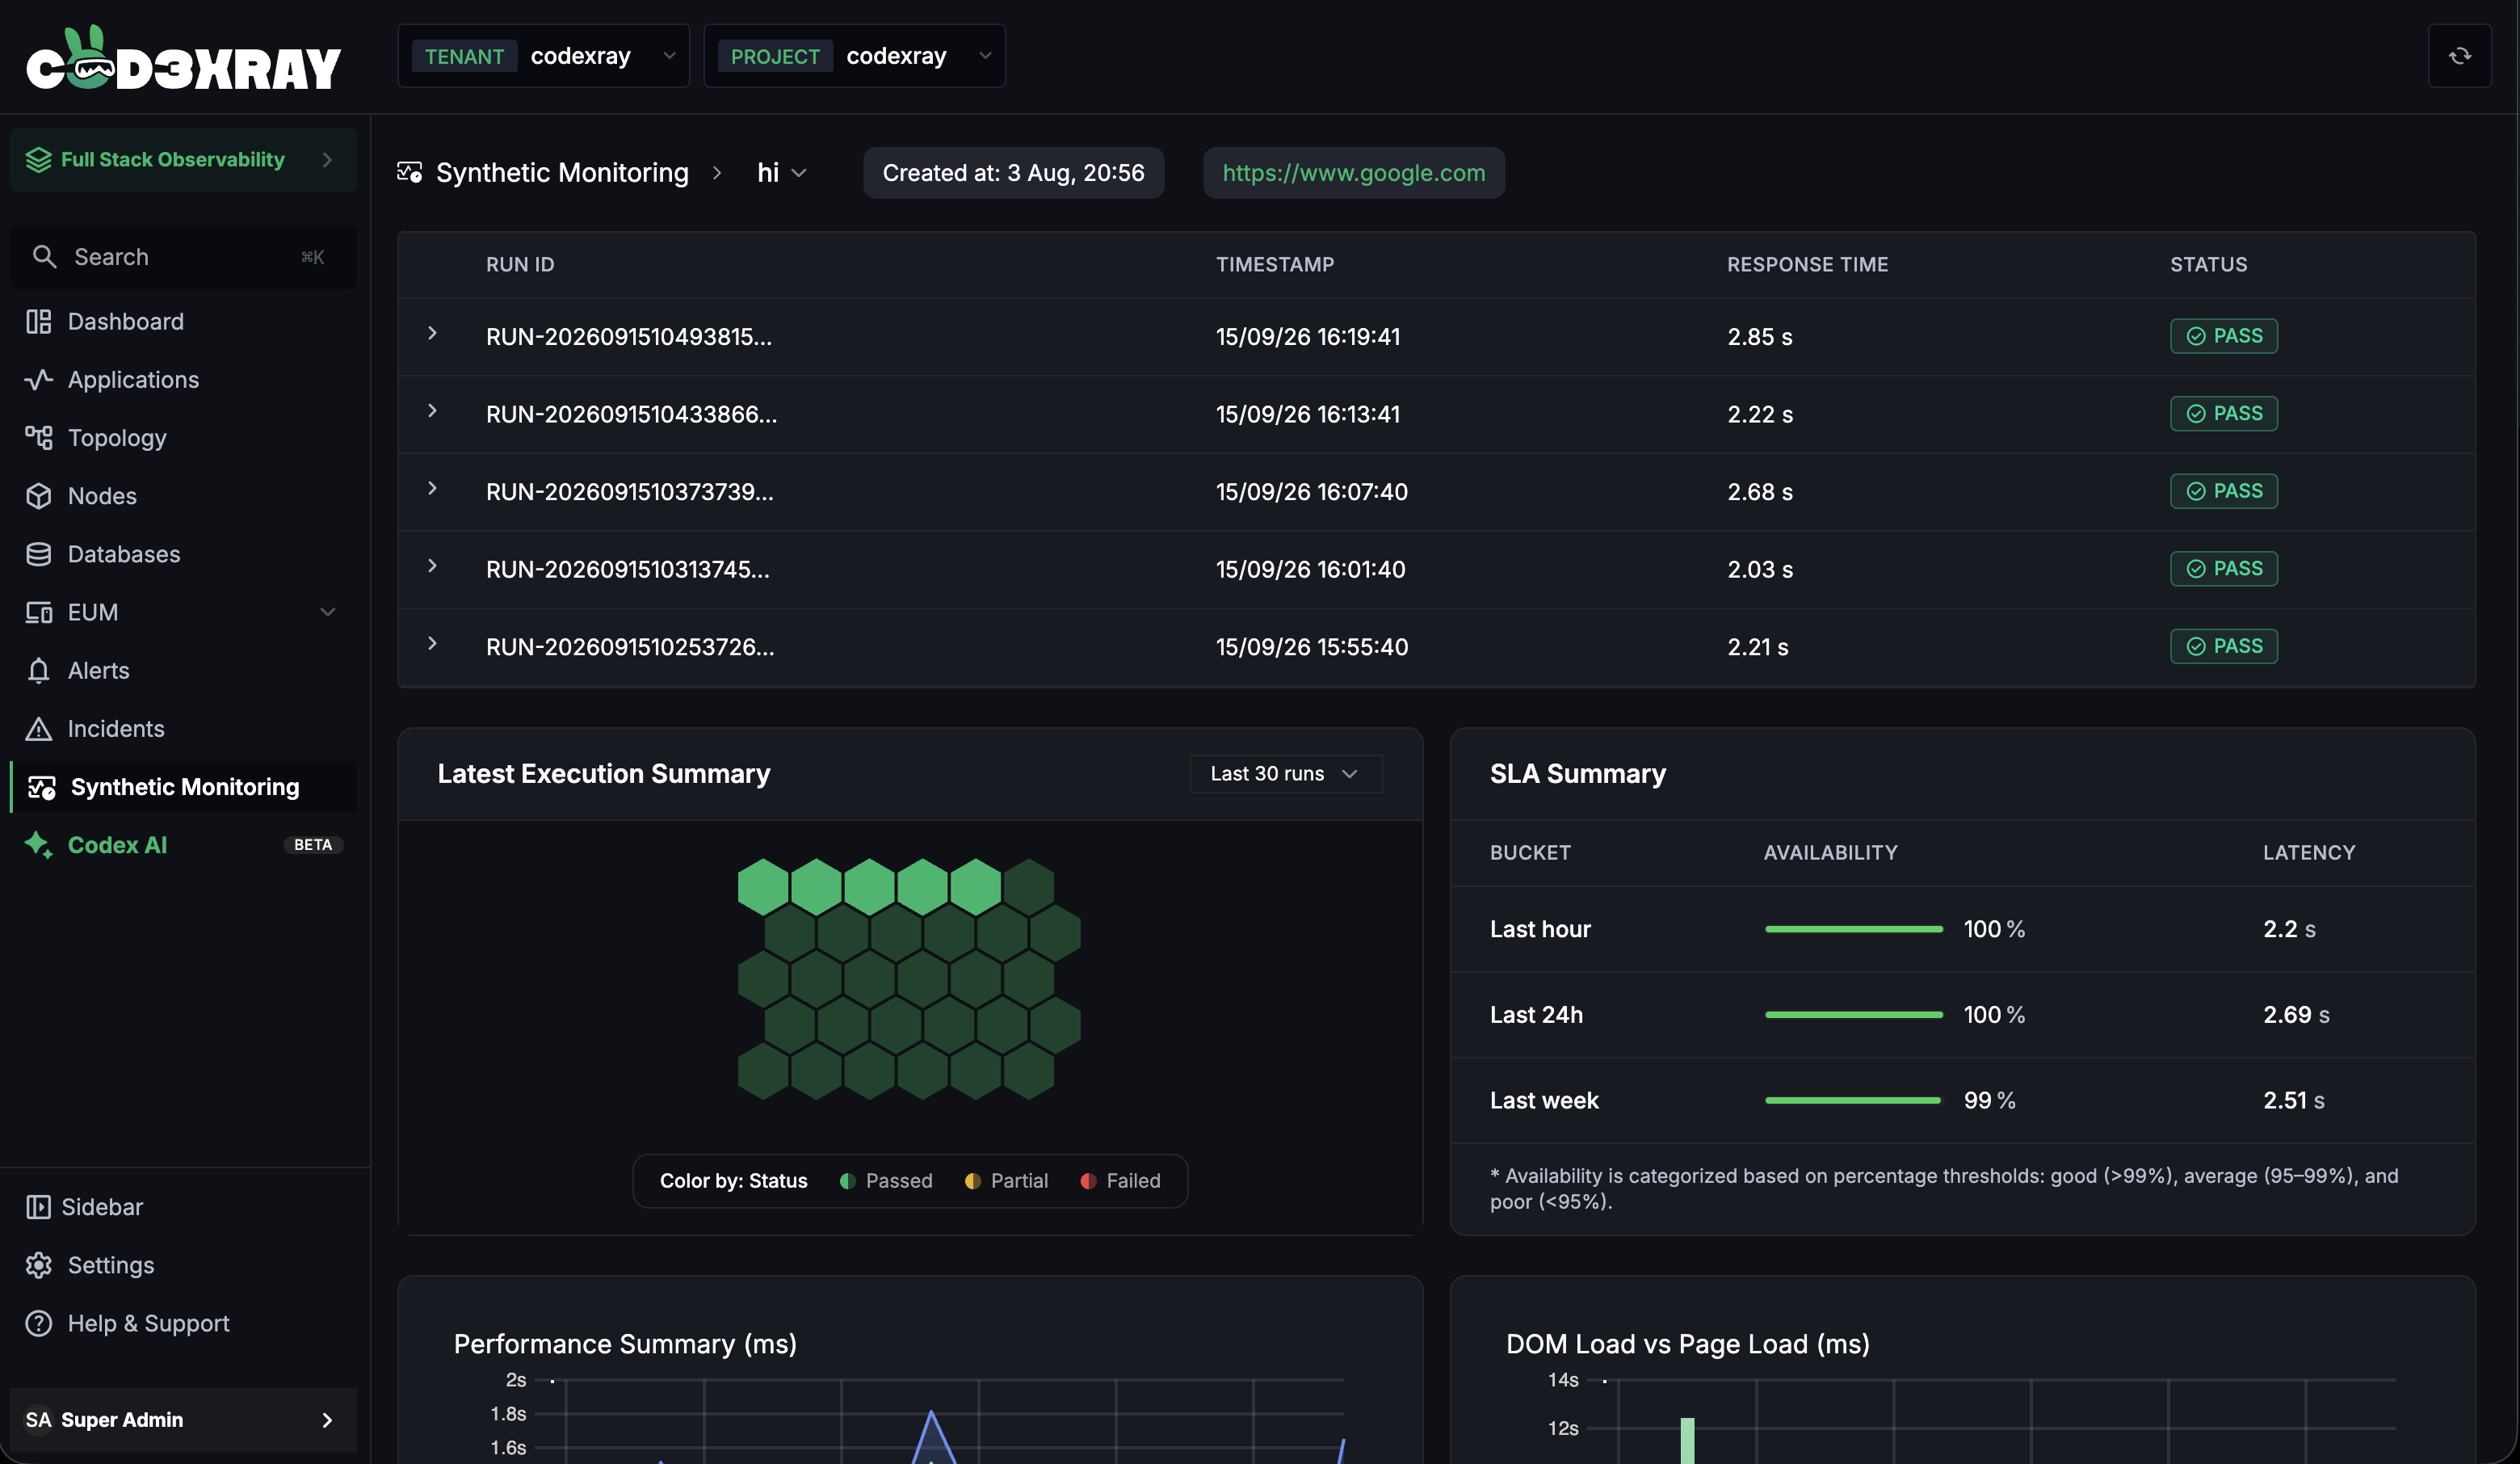
A job that has never run shows only: "This job hasn't run yet. Results appear here after its first run." Everything below appears once the first run completes.
Last 5 runs
The runs table at the top lists the job's most recent runs — run id, timestamp, response time, and result (a green PASS or red FAIL pill).
Expand a row (the chevron on the left) to see that run in full:
- Web-vitals cards — TTFB, FCP, LCP, CLS, and Page Load, each with its value and a grade chip (Good / Needs Improvement / Poor).
- Per-step breakdown — every step in the journey with its result and timing, and an Error column. When a run fails, the failing step is highlighted and its error message is shown — this is where you find which step broke and why.
When a run comes back Fail or Partial, expand it and read down the steps table to the first red one. The Error column tells you what happened — a missing element, a page that wouldn't load, a timeout — so you can reproduce and fix it.
Latest Execution Summary (the honeycomb)
Each recent run is a hexagon, coloured by result, newest first.
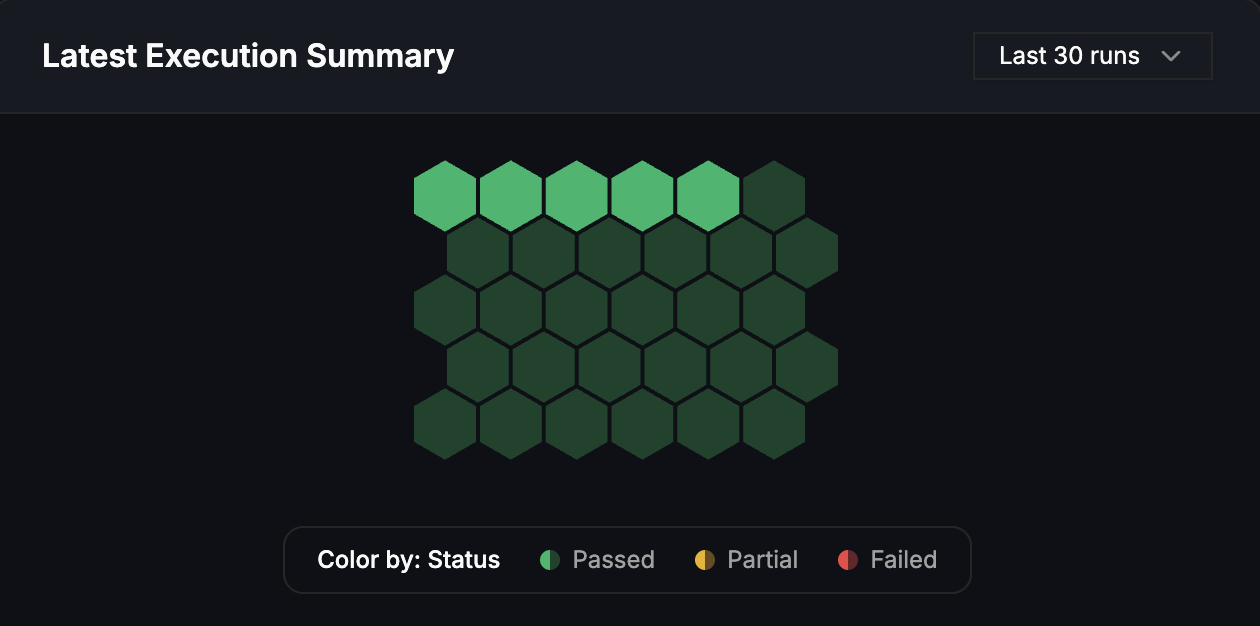
- Switch between the Last 7, Last 15, and Last 30 runs with the dropdown (30 by default).
- The legend colours results Passed (green), Partial (amber), and Failed (red).
- Hover any hexagon for that run's Total Response Time and its TTFB / FCP / LCP / CLS / Page Load with grades; a failed run also shows its Failed Step and Error.
- Click one of the five most recent hexagons to jump to its row in the Last 5 runs table below. Older hexagons are dimmed and not clickable — the table underneath holds the five most recent, so there's nothing to open for the rest.
SLA Summary
A quick read on reliability and speed across three windows — Last hour, Last 24h, and Last week.
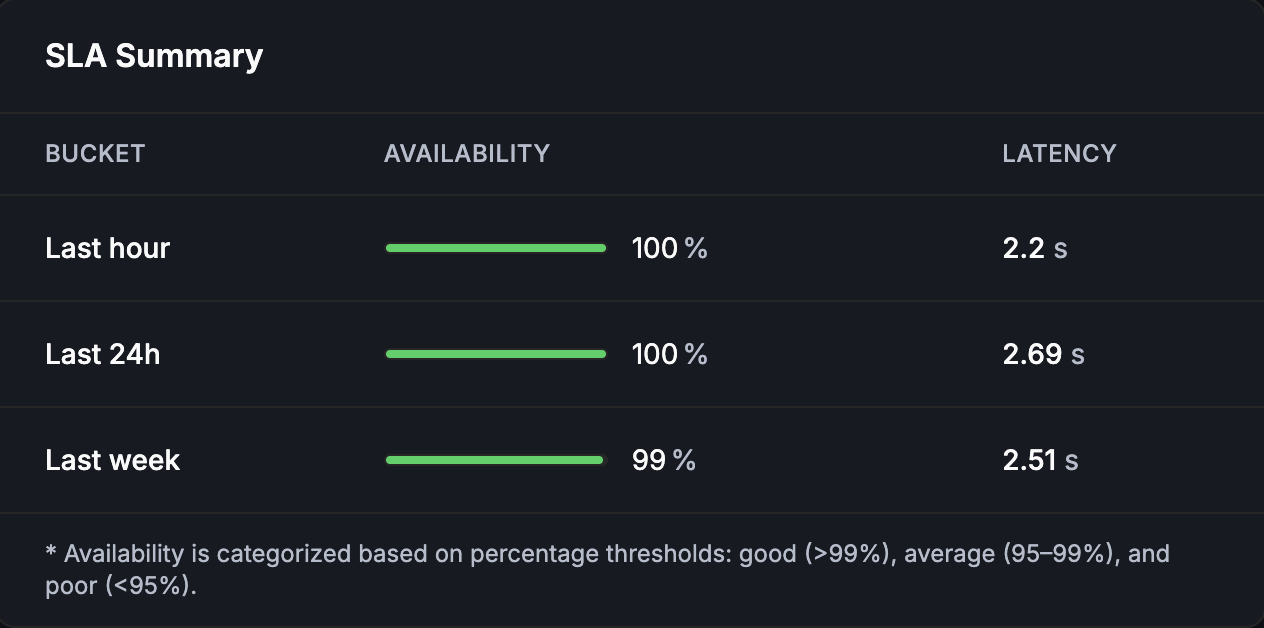
Each row shows availability (the share of runs that passed) as a coloured bar, plus typical latency. The availability bar is:
- Green above 99%
- Amber between 95% and 99%
- Red below 95%
The SLA Summary always shows all three windows — Last hour, Last 24h, Last week — even when a window contains no runs yet.
Performance charts
Two time-series charts track how the journey's speed trends over the retained window:
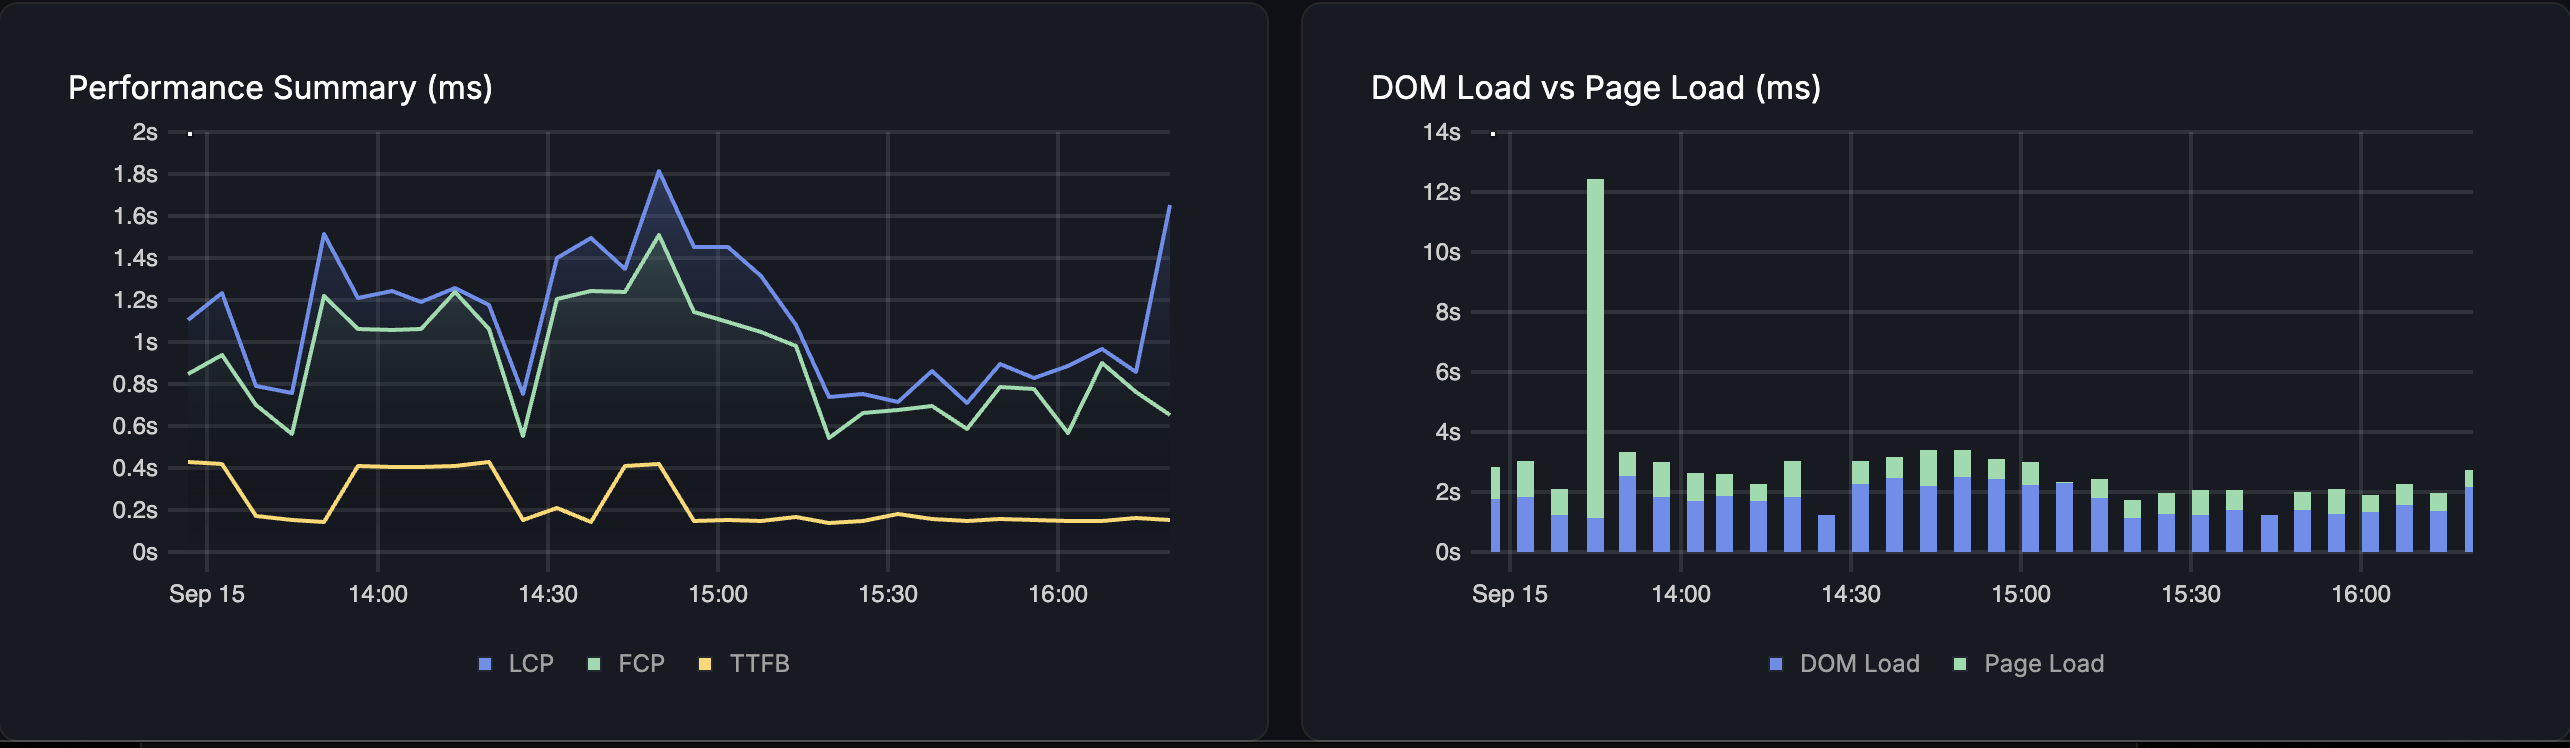
- Performance Summary (ms) — LCP, FCP, and TTFB as three lines, so you can see which stage of loading is drifting.
- DOM Load vs Page Load (ms) — how long the document, then the whole page, takes to finish.
Things you'll notice (and shouldn't worry about)
- Only the five most recent hexagons are clickable. The older ones are deliberately dimmed — there's no run row to open for them.
- A job can briefly show as Running after it finished. The state corrects itself on the next refresh.
- Results older than 30 days disappear. Run history is kept for 30 days; the job setup is kept until you delete it.
- A "Partial" result isn't a failure — some steps worked and at least one didn't.
Next steps
- Creating & Managing Jobs — build, run, pause, and manage jobs
- Synthetic Monitoring Overview — concepts, statuses, and web-vitals grading
- Alerts — be notified automatically when a journey breaks